PostgreSQL VS MariaDB Performance Comparison
Last updated: November 9 2024
Table of contents
- Reserva comparison
- HammerDB comparison
In this article, I conduct original research into the performance of MariaDB and PostgreSQL using:
- Reserva, a custom benchmarking tool I created to simulate a high volume digital payments system.
- HammerDB, the world’s leading database benchmarking tool.
PostgreSQL is 55% faster in my most recent tests, but both systems will serve you well as a general-purpose RDBMS.
Reserva comparison
Reserva is a system I made to simulate a streamlined, high volume payments processing system. It is written in Go and supports arbitrary amounts of concurrency.
On start, Reserva loads all users and authentication tokens into memory, then attempts to make as many funds transfers as possible in a loop. Each funds transfer requires 4 round trips to the database and touches 6 tables. The workflow is as follows:
- DB is queried to authenticate and authorize the user who is requesting payment.
- DB is queried to get information about the card used and account to be debited.
- DB is queried to authenticate and authorize the user who will approve or deny the payment request.
- DB is queried to update both account balances and record the payment.
Reserva allows you to select whether or not you want deletes to be part of the workload. The results on this page do include deletes as part of the workload.
Hardware
Let’s talk about the hardware, database versions, and configurations that were used to conduct this test.
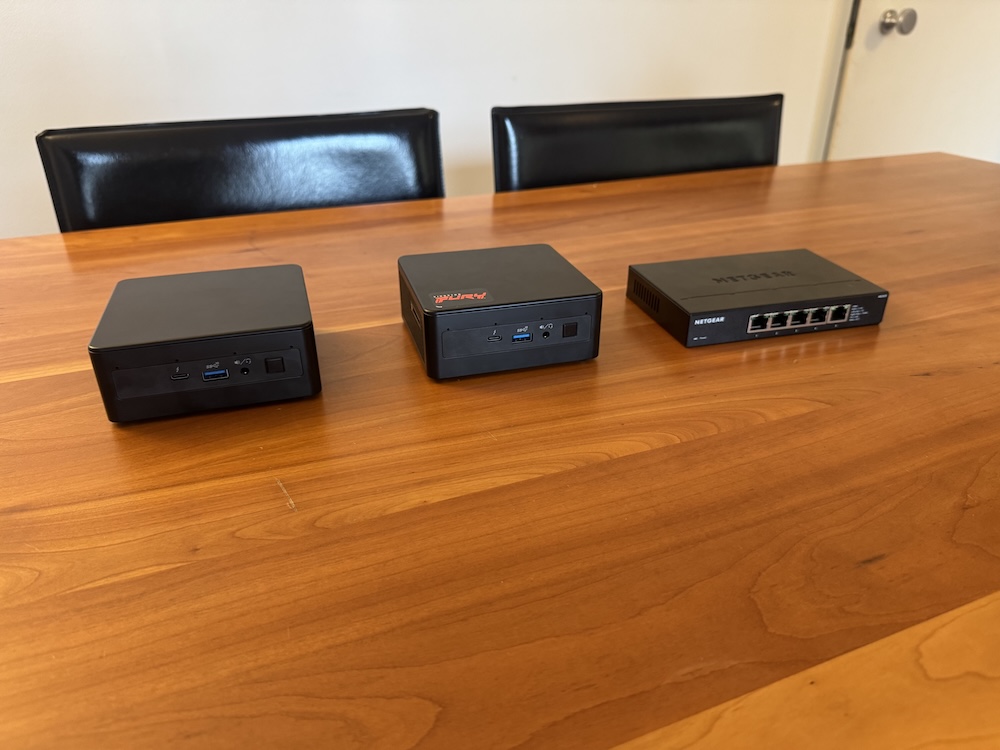
I plan on running a lot of database benchmarks in the near future, and constantly paying for cloud services was starting to get expensive. So, I decided to purchase a few mini PCs and a networking switch to simulate a modern cloud environment.
Also, I like buying computer stuff 😃.
CPUs
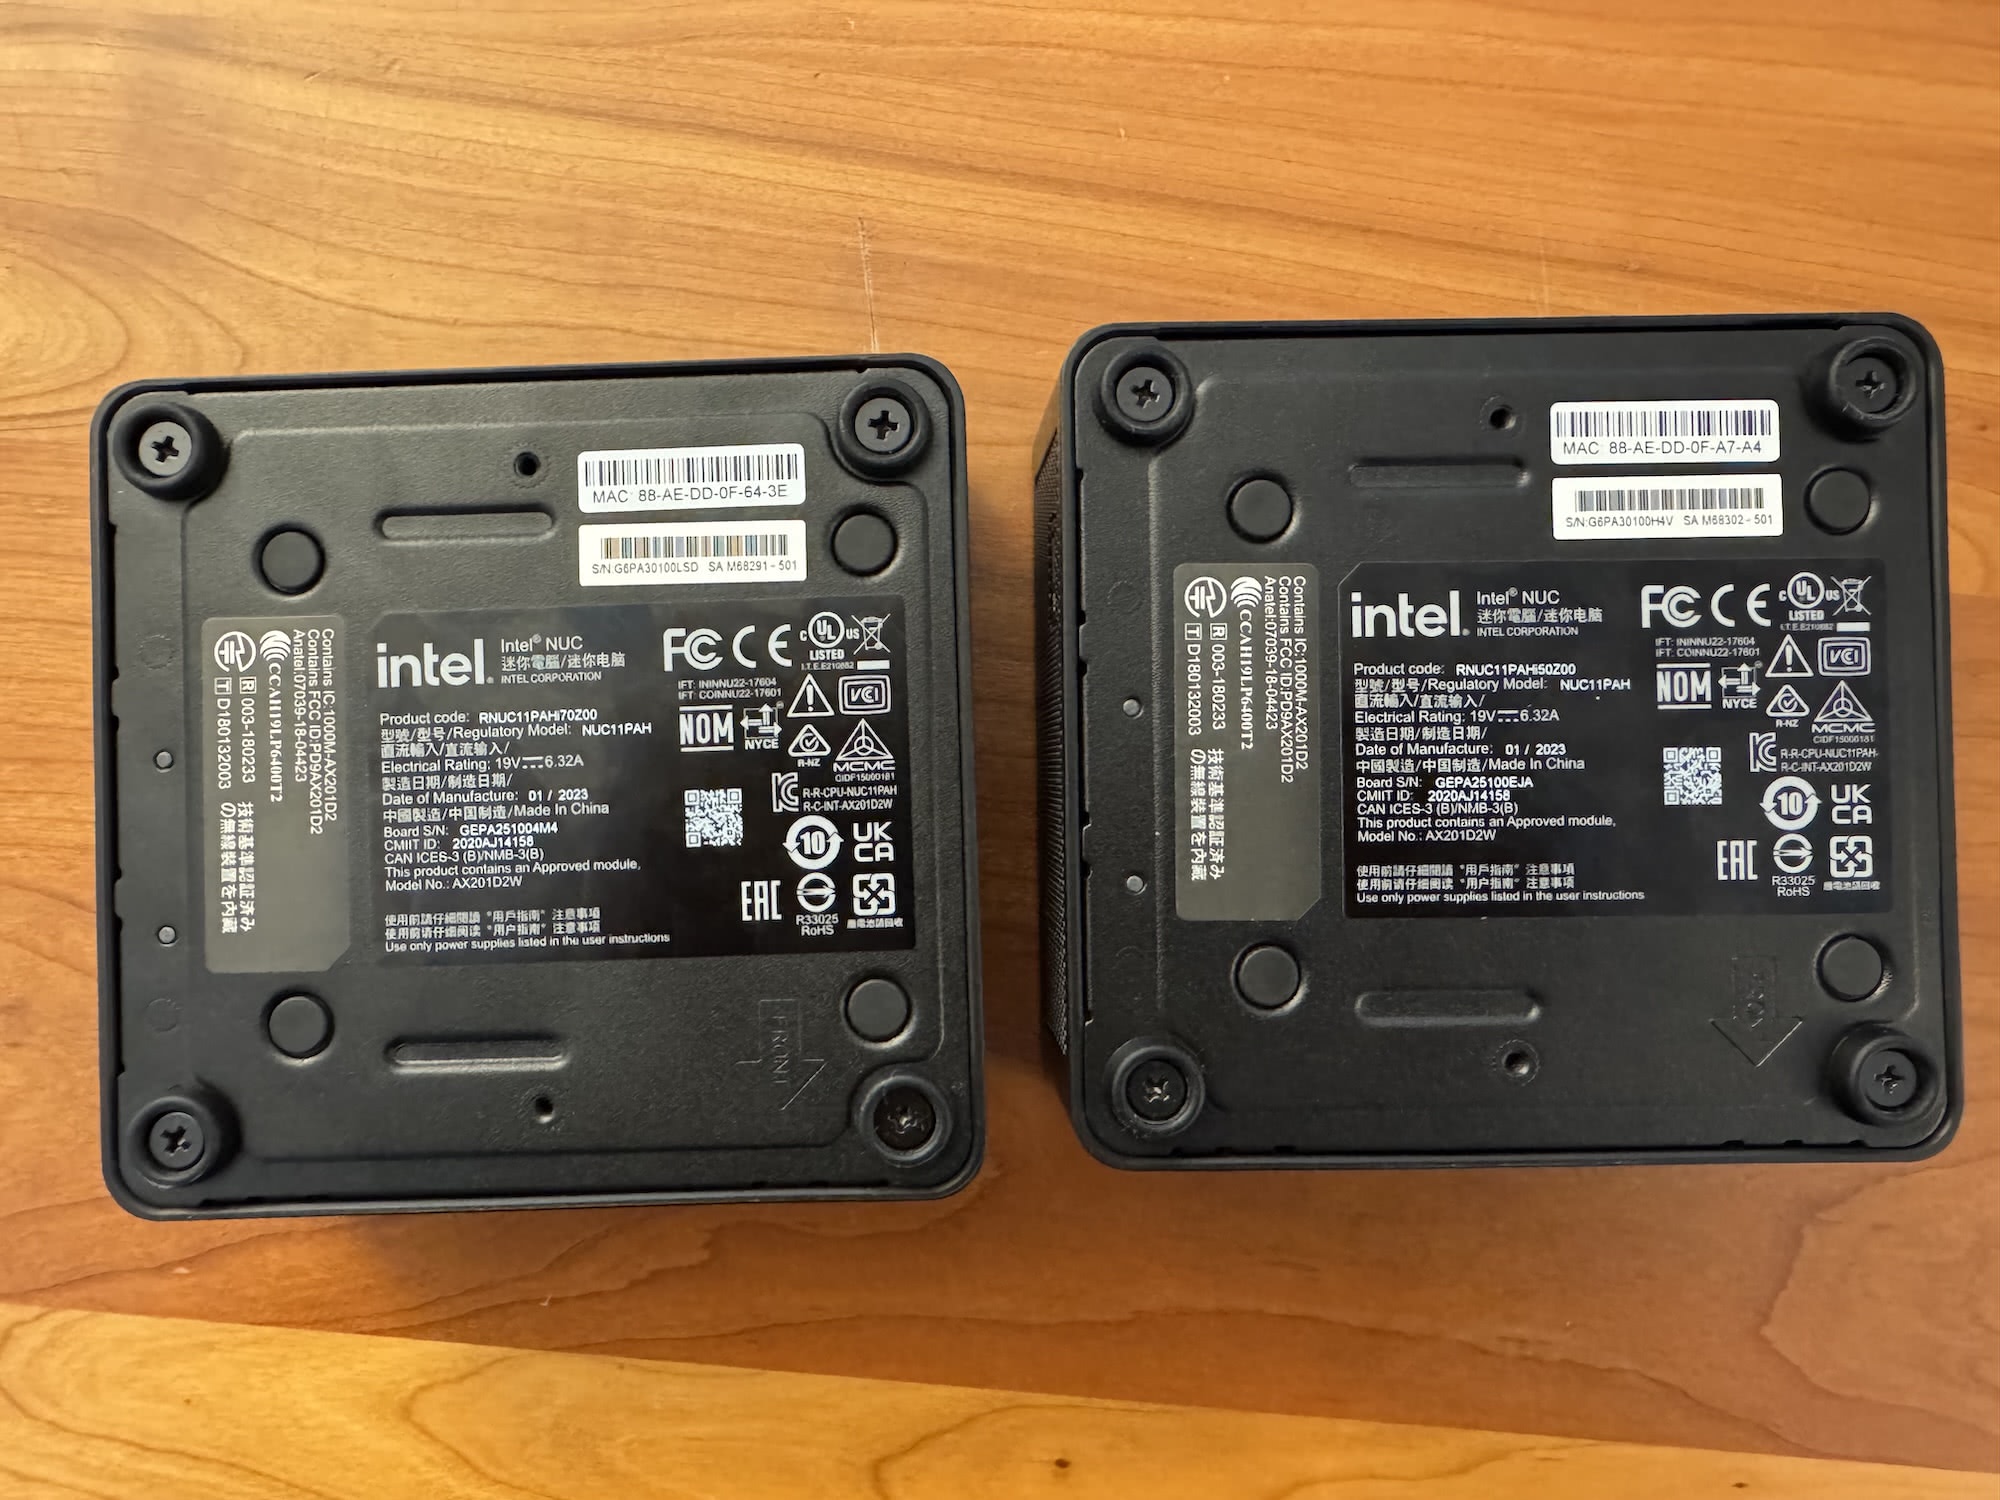
The mini PCs were 11th gen Intel NUCS. Specifically, they are:
- NUC11PAHi70Z00, which has an i7-1165G7 processor.
- NUC11PAHi50Z00, which has an i5-1135G7 processor.
I put the database servers on the computer with the i7 processor, because Reserva is less CPU intensive than the database programs it’s designed to test.
Both chips have 4 hyperthreaded cores for a total of 8 threads. This makes them comparable to an 8 vCPU VM that you might rent in the cloud. They also have a TDP of 28 watts, which I measured during load. In fact, these computers are well cooled and sometimes even surpass 28 watts!
RAM / Disks
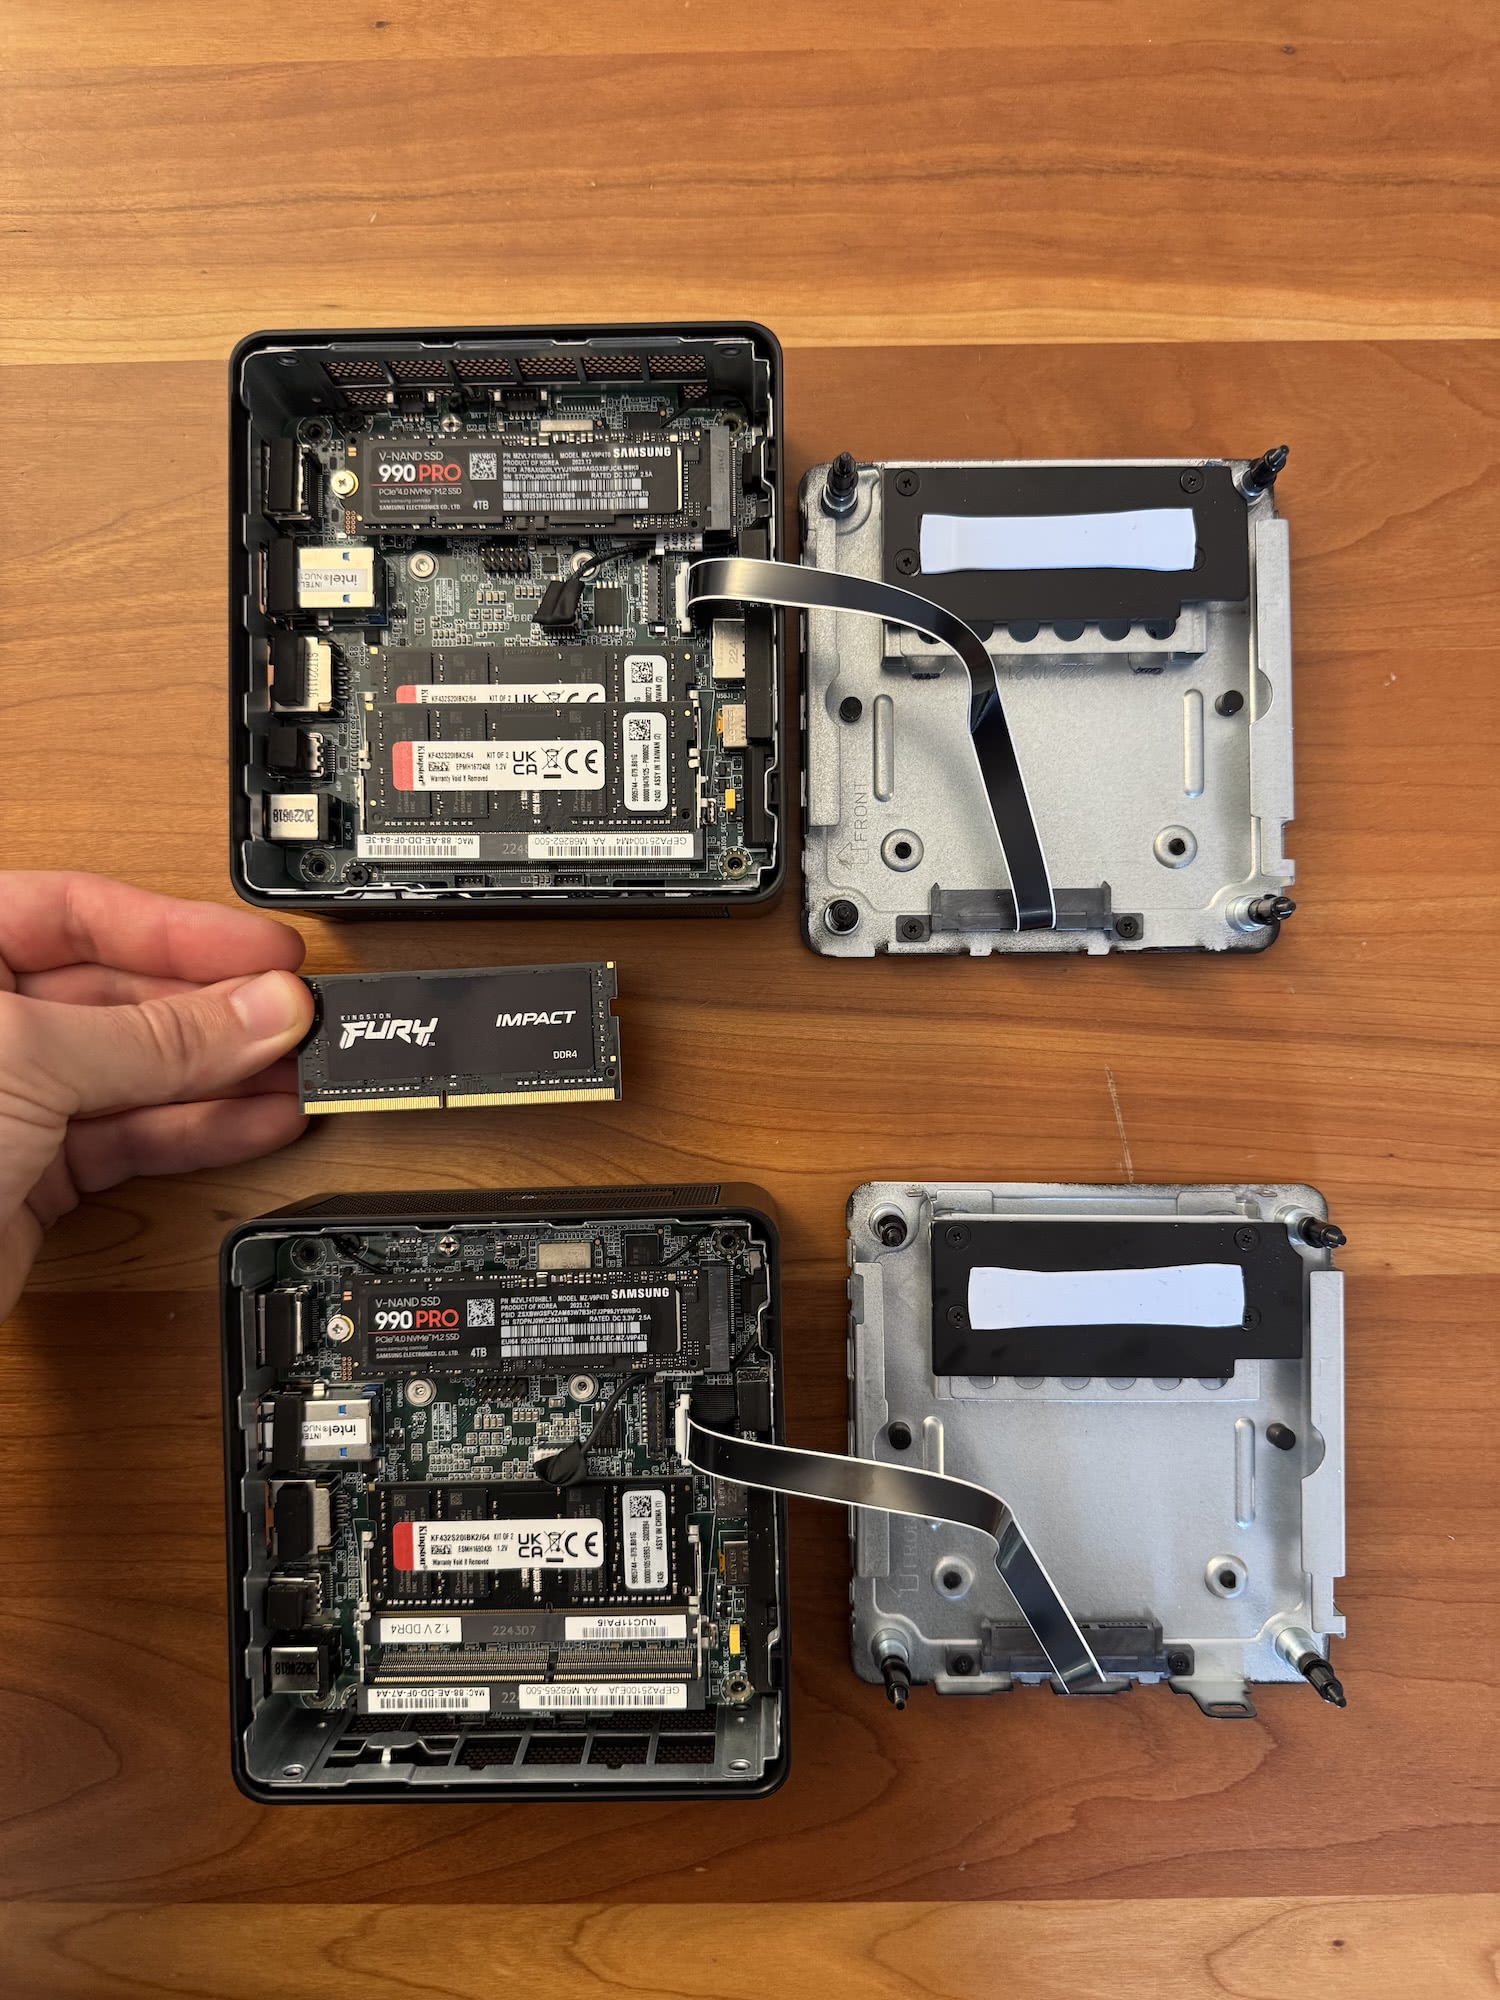
I purchased high quality RAM and SSDs to get the most out of these mini PCs. They are both outfitted with:
- 64 GB, dual-channel 3200 MHz Kingston Fury RAM
- 4 TB Samsung 990 Pro PCIe 4 SSD
It is well known that databases can become bottlenecked by slow disks, so I paid particular attention to my choice of SSD. The Samsung 990 Pro is, as far as I’m aware, one of the fastest PCIe 4 disks available on the market.
Networking
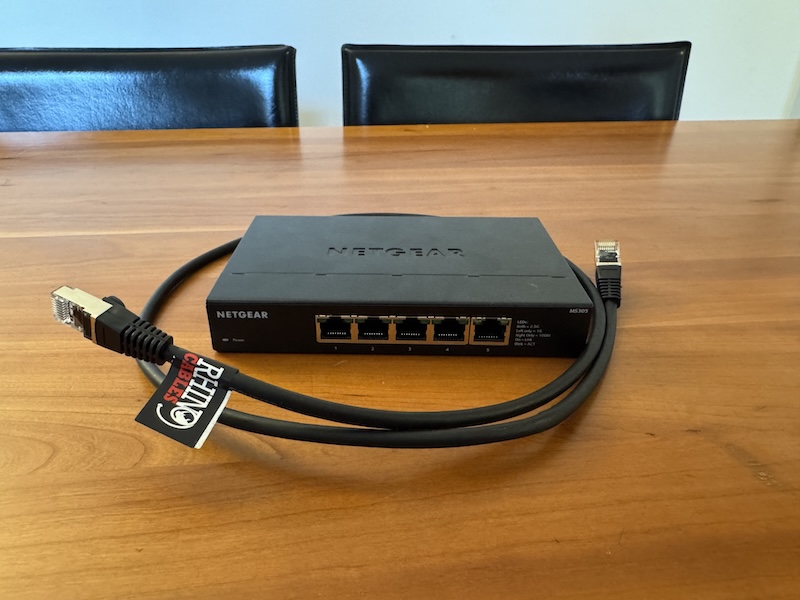
I initially conducted these tests using my M1 MacBook Air connected to one of the mini PCs via WiFi. However, I noticed right away how much that relatively poor connection slowed down the benchmark results. Over WiFi 6 with a strong connection, PostgreSQL was only able to complete 300-500 transfers per second. This was 30X slower than I eventually achieved!
So, I decided to go all in and buy another mini PC, plus:
- Netgear MS305 2.5 gigabit networking switch
- Rhino Cables cat6a ethernet cables.
This brought my network latency, as measured with ping, from several milliseconds down to around 0.65 milliseconds. This imperceptibly small difference in latency made a huge difference in my end test results. So, pay attention to networking, folks!
Comparable cloud instances
Here are a couple of comparable database servers with 8 vCPUs and 64 GB of RAM from AWS and Azure:
Before storage, it would cost about $846.72 per month to rent a similar machine on AWS.
Despite their size, these are powerful computers with resources that resemble a busy, production quality system.
Databases
Now, let’s discuss the databases used and how they were configured.
PostgreSQL config
I deployed the postgres:17.0-bookworm Docker image on the i7 mini PC.
I spent a whole day configuring performance parameters and found that, for this particular use case, the only one that made any real difference was shared_buffers.
The PostgreSQL docs recommend a value of around 25% of total system RAM for shared_buffers, so I used the following minimal postgresql.conf file:
listen_addresses = '*'

shared_buffers = 16GB
MariaDB config
I used the mariadb:11.5.2-noble Docker image to deploy MySQL. After quite a few tests, I found that the only setting that actually improved performance was setting innodb_buffer_pool_size to the recommended size of 75% of system RAM. As such, I used the following configuration file:
[mariadb]

innodb_buffer_pool_size = 48G
Populating data
For each database, I ran a DB preparation SQL scripts to create:
- 50 banks with access to the payments system and corresponding users + permissions + auth tokens
- 1,000,000 accounts, each with a corresponding payment card
You can see the SQL setup scripts, along with the rest of the code, on Reserva’s Github page.
The test
I ran Reserva with the following settings for both databases:
- 64 concurrent requests at a time
- Maximum of 64 open database connections (idle or active)
- 2 hour duration
- Deletes enabled as part of the workflow
Aggregation query
At the end of the test, I executed the following queries to show how many payments were made. The results of those queries are visualized below.
PostgreSQL query
SELECT
    DATE_TRUNC('minute', CREATED_AT) AS MINUTE,
    COUNT(*) AS NUMBER_OF_TRANSFERS
FROM
    TRANSFERS
GROUP BY
    MINUTE
ORDER BY
    MINUTE;
MariaDB query
SELECT
    hour(CREATED_AT) AS hour_created_at,
    minute(CREATED_AT) AS minute_created_at,
    COUNT(*) AS NUMBER_OF_TRANSFERS
FROM
    transfers
GROUP BY
    hour_created_at, minute_created_at
ORDER BY
    hour_created_at, minute_created_at;
Results

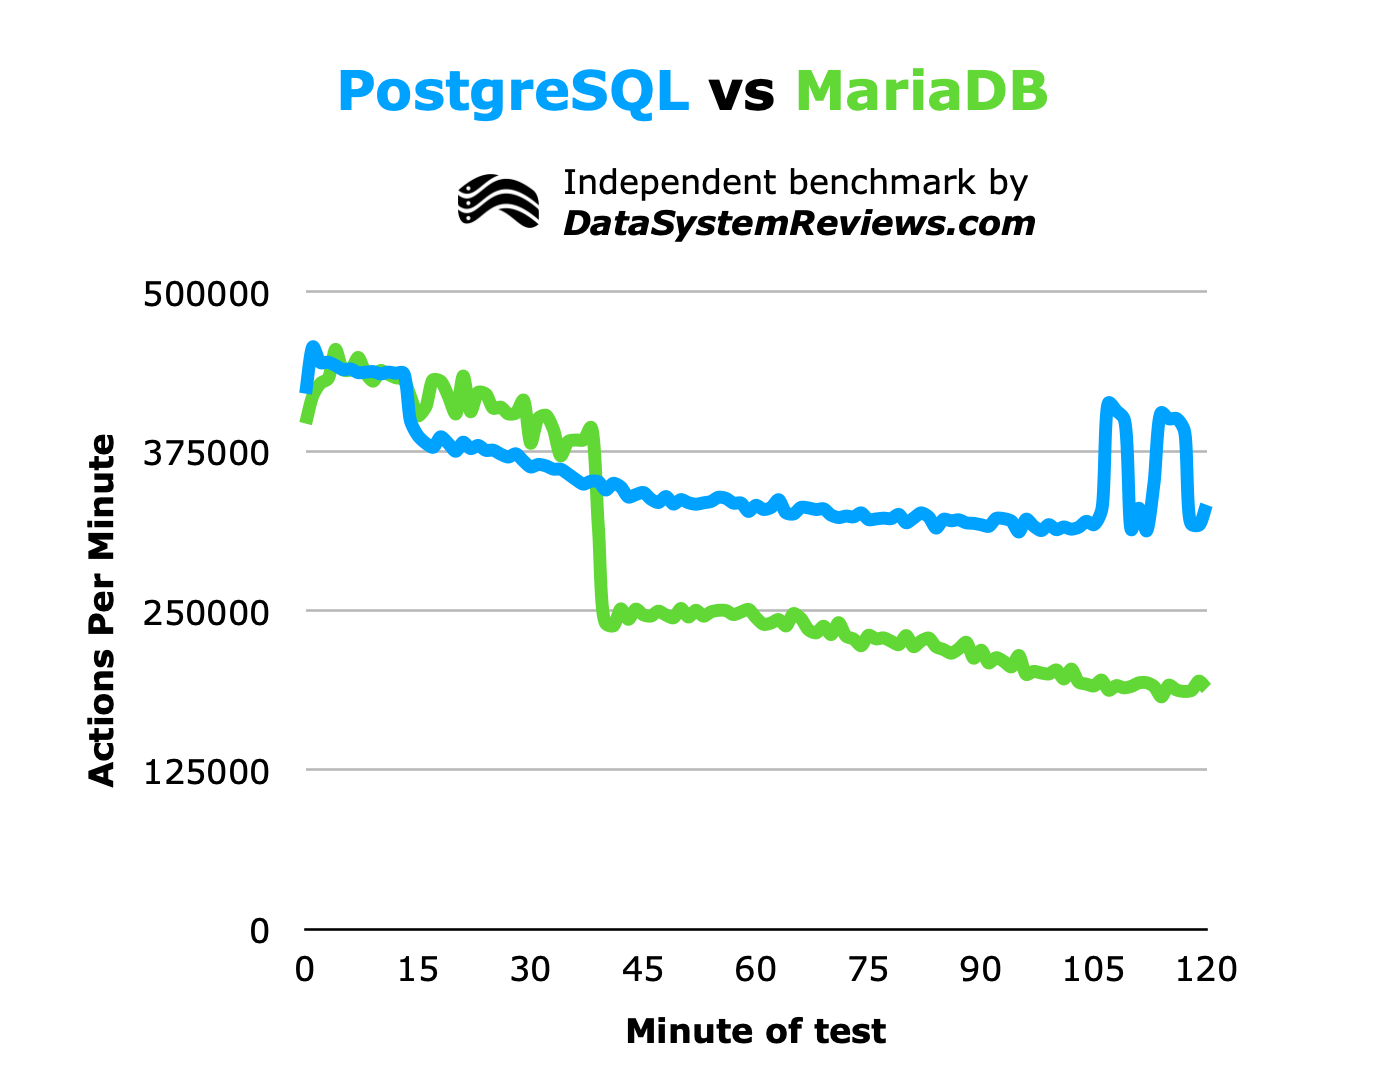
As you can see, PostgreSQL outperformed MariaDB. However, MariaDB was outperforming PostgreSQL for a while in the first half of the test, and I thought it might turn out to be the winner. That didn’t turn out to be the case.
PostgreSQL’s consistency throughout the test won the day, however. MariaDB had a large dropoff in performance around the 40 minute mark. I don’t have an explanation for why that happened, despite re-running the test a few times and inspecting the benchmarking tool’s code.
Both databases were tested with an identical version of Reserva, but I am constantly making changes to the program to improve its ability to test databases. Maybe some recent change I made resulted in MariaDB’s drop in performance? I guess that will play out in the near future as I perform more tests with it.
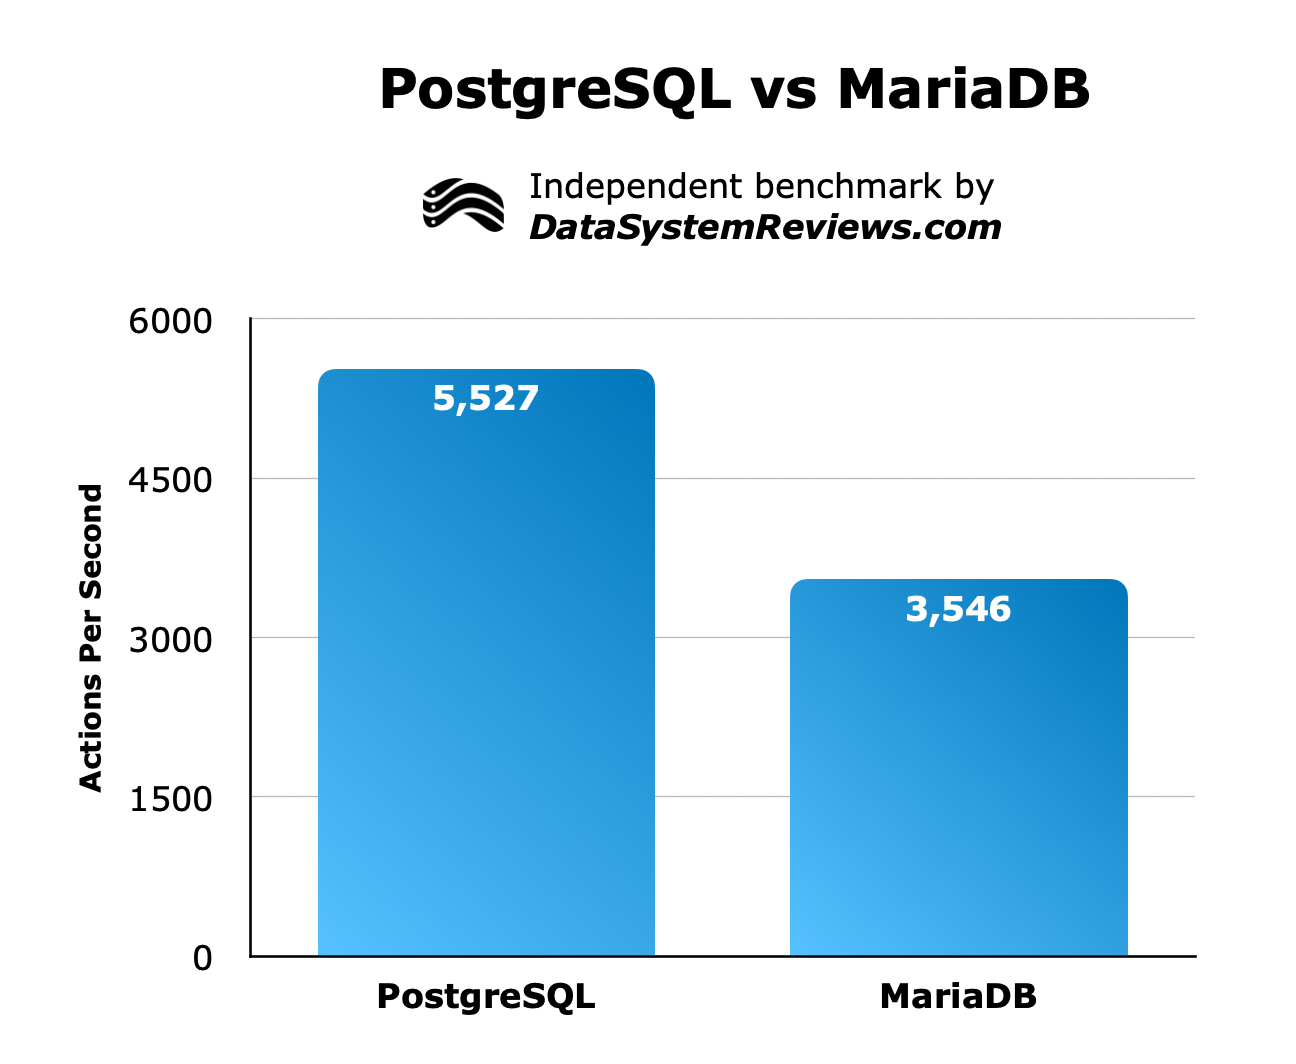
Here is another way of viewing the test results, where I’ve averaged the amount of payments made over the last 60 minutes of the test, and divided by 60 to put the results in “payments per second” format:
Conclusion
PostgreSQL is much faster than MariaDB in these tests.
HammerDB comparison
A few years ago, I conducted a test on these two systems with HammerDB. In these tests, PostgreSQL significantly outperformed MariaDB, but I think these results are outdated.
I’m going to leave these results up until I have a chance to re-run another test with the latest version of HammerDB, and of each database.
PostgreSQL, MariaDB, and HammerDB deployment
To compare the performance characteristics of these SQL databases, I deployed two AWS RDS instances, along with an EC2 instance running HammerDB.
RDS is Amazon’s service for deploying managed relational databases. This service is a great way to get the most out of a database without being an expert on replication strategies, memory allocation/configuration, or other details required to maintain high availability, high performance, and data integrity.
Deploying the databases in this way allowed me to compare their data access efficiency, with as little variance coming from configuration and hardware differences as possible.
HammerDB is a popular, open source database performance testing software. It implements a test called TPROC-C, which is loosely based on the TPC-C benchmark. You can read more about TPC’s other measures on TPC’s official page.
PostgreSQL benchmark setup
- Version: PostgreSQL 13.3
- Instance type: DB.m5.large
- Two x86 cores
- 8 GB of RAM
- 100 GB of storage
- gp2 storage type (no provisioned IOPS)
- No replication of any kind (no multi-AZ or horizontal partitioning)
- No data encryption at rest
MariaDB benchmark setup
- Version: MariaDB 10.5.13
- Instance type: DB.m5.large
- Two x86 cores
- 8 GB of RAM
- 100 GB of storage
- gp2 storage type (no provisioned IOPS)
- No replication of any kind (no multi-AZ or horizontal partitioning)
- No data encryption at rest
HammerDB benchmark setup
- Version: HammerDB 4.3
- Operating system: Debian 11
- Instance type: t3.medium
- Two x86 cores
- 4 GB of RAM
Benchmark setup
Now that we have the hardware and software deployed, we can give HammerDB the database credentials and issue a command to set up the test schemas. HammerDB provisions the following structured data schema in both PostgreSQL and MariaDB.
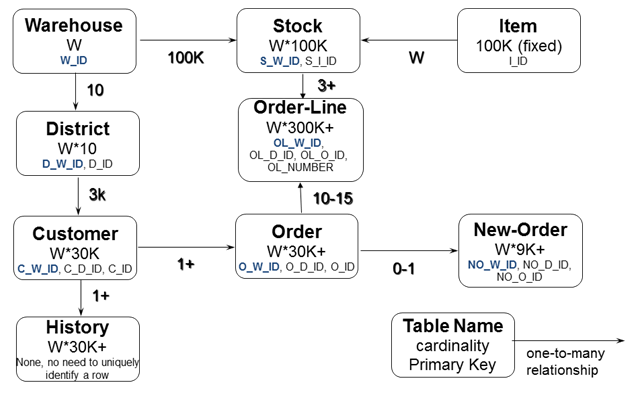
This schema approximates a simple online transactional processing (OLTP) database. Most “real” databases will have more tables than this, but it is a good starting point with enough variety to simulate real-world usage.
According to the official HammerDB docs:
… the workload is defined by a mix of 5 transactions selected at random according to the balance of the percentage value shown as follows:
- New-order: receive a new order from a customer: 45%
- Payment: update the customer’s balance to record a payment: 43%
- Delivery: deliver orders asynchronously: 4%
- Order-status: retrieve the status of customers most recent order: 4%
- Stock-level: return the status of the warehouse’s inventory: 4%
In our opinion, this database structure and query mix will properly test indexes, read-write performance, and general ability for storing data. It will not require advanced features, complex queries, or data warehouse-style queries, but that is not the point of a transactional test.
PostgreSQL setup
For PostgreSQL, we simply connected as the superuser postgres, on port 5432 and built ten “warehouses”, which are essentially duplicate schemas. This duplication of warehouses may somewhat overcome the fact that such a limited schema would only be possible in smaller databases.
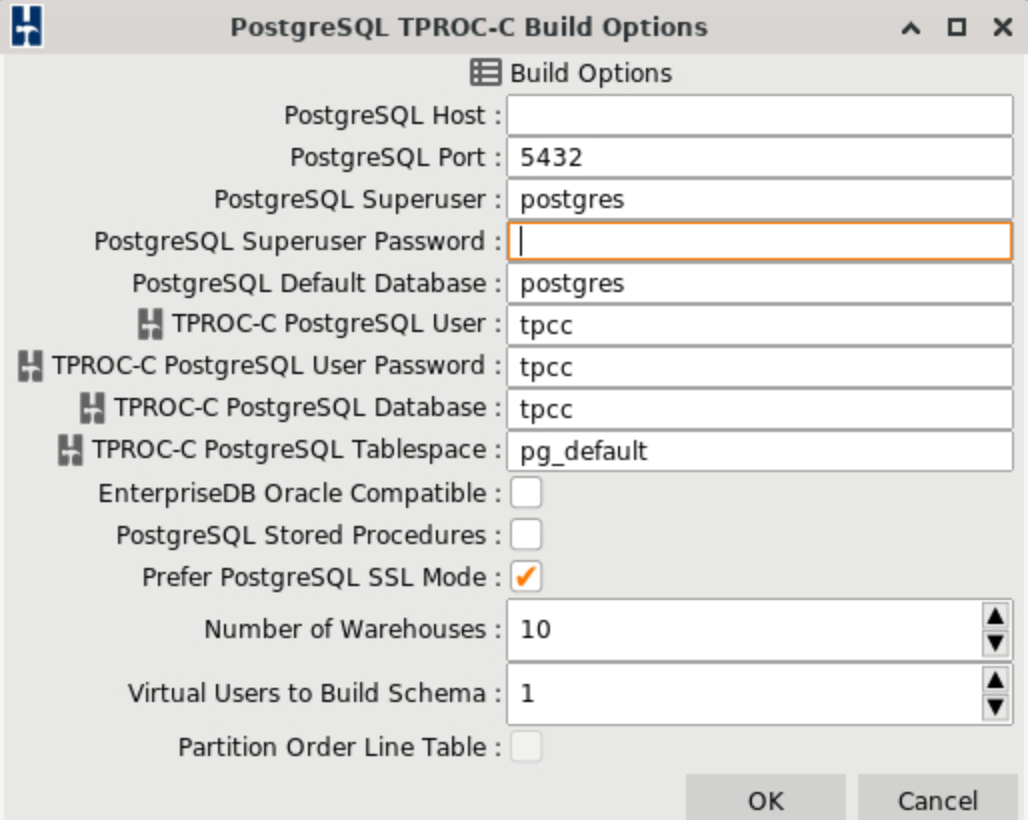
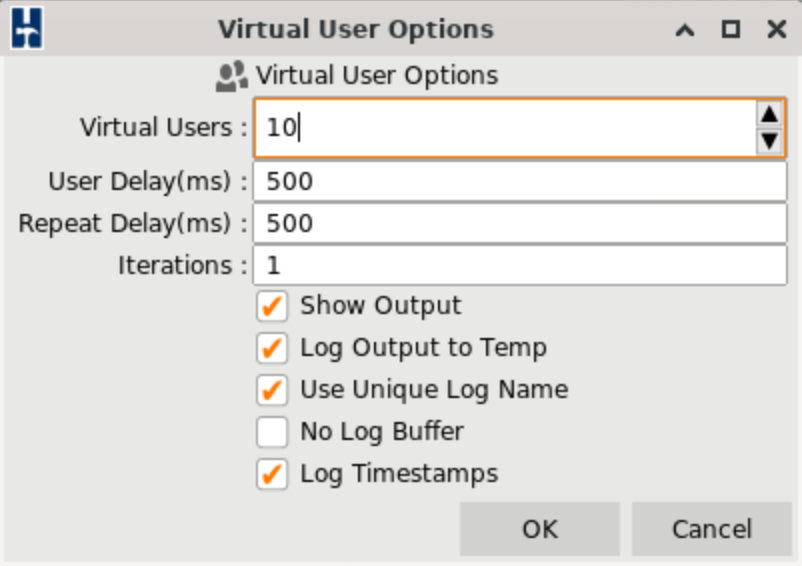
I then created ten virtual users and logged their output. I setup the test in this way to approximate ten backend servers querying the database simultaneously, which is not an unreasonable load to expect for a busy database. PostgreSQL supports many more concurrent users, but 10 is a nice round number to start.
MariaDB setup
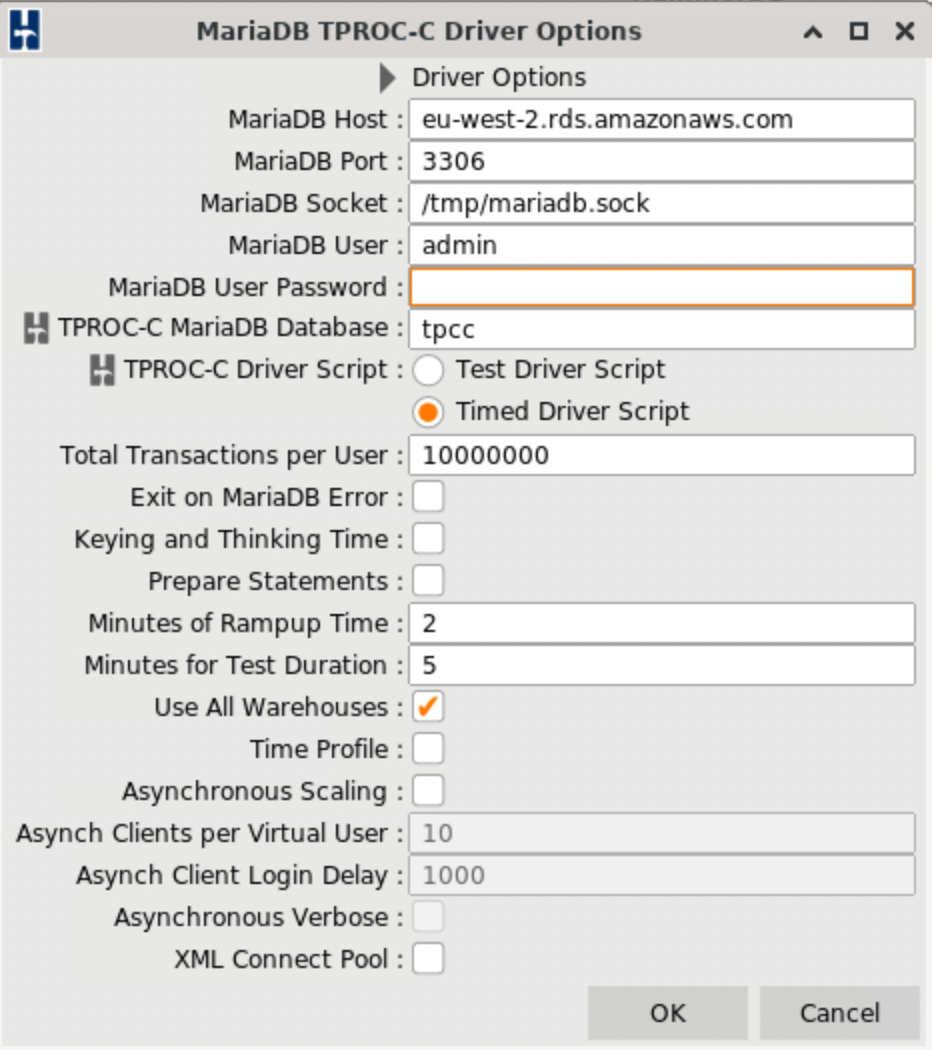
As you can see, the setup is primarily the same for MariaDB. We used the root user, the InnoDB storage engine, and the default port to connect to the database and build ten warehouses.
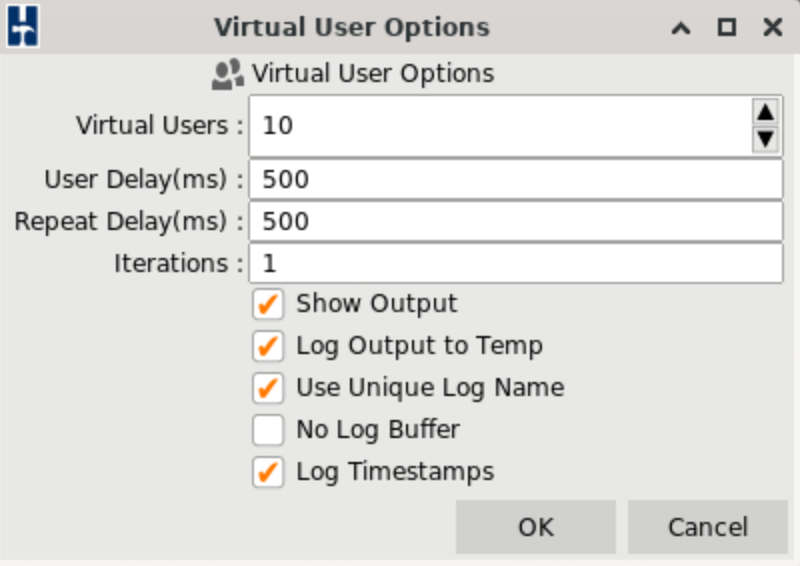
Once again, we created ten users to simulate ten backend servers querying the database.
Running the tests
And now, we will show the configuration we used to run the tests and show what HammerDB looked like during the run.
PostgreSQL
To start the test for PostgreSQL, we selected “Timed driver script” and left everything else on default, except checking the “Use all warehouses” box.
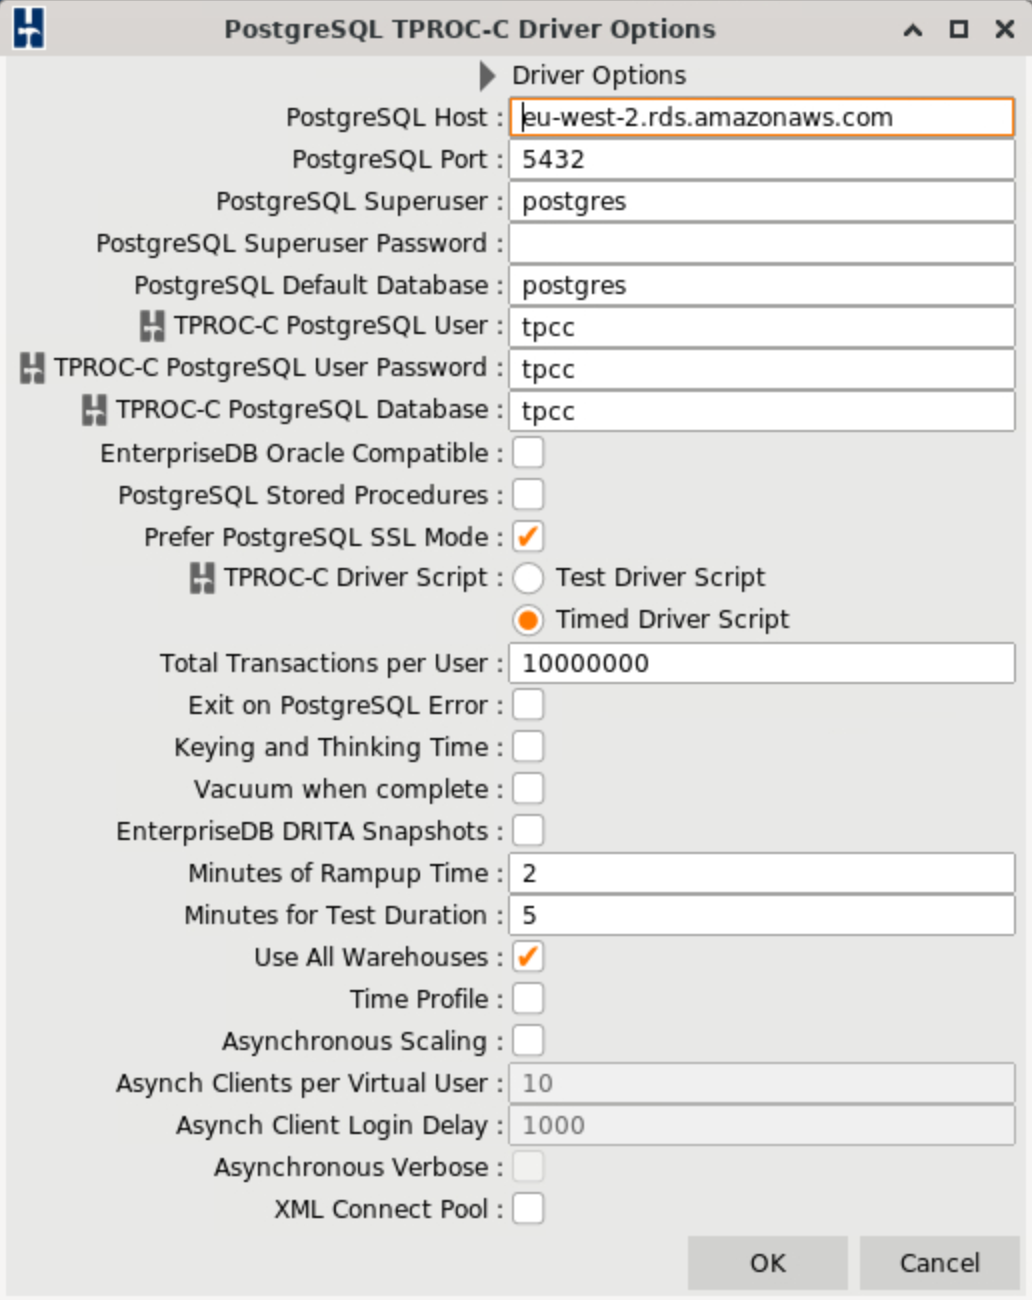
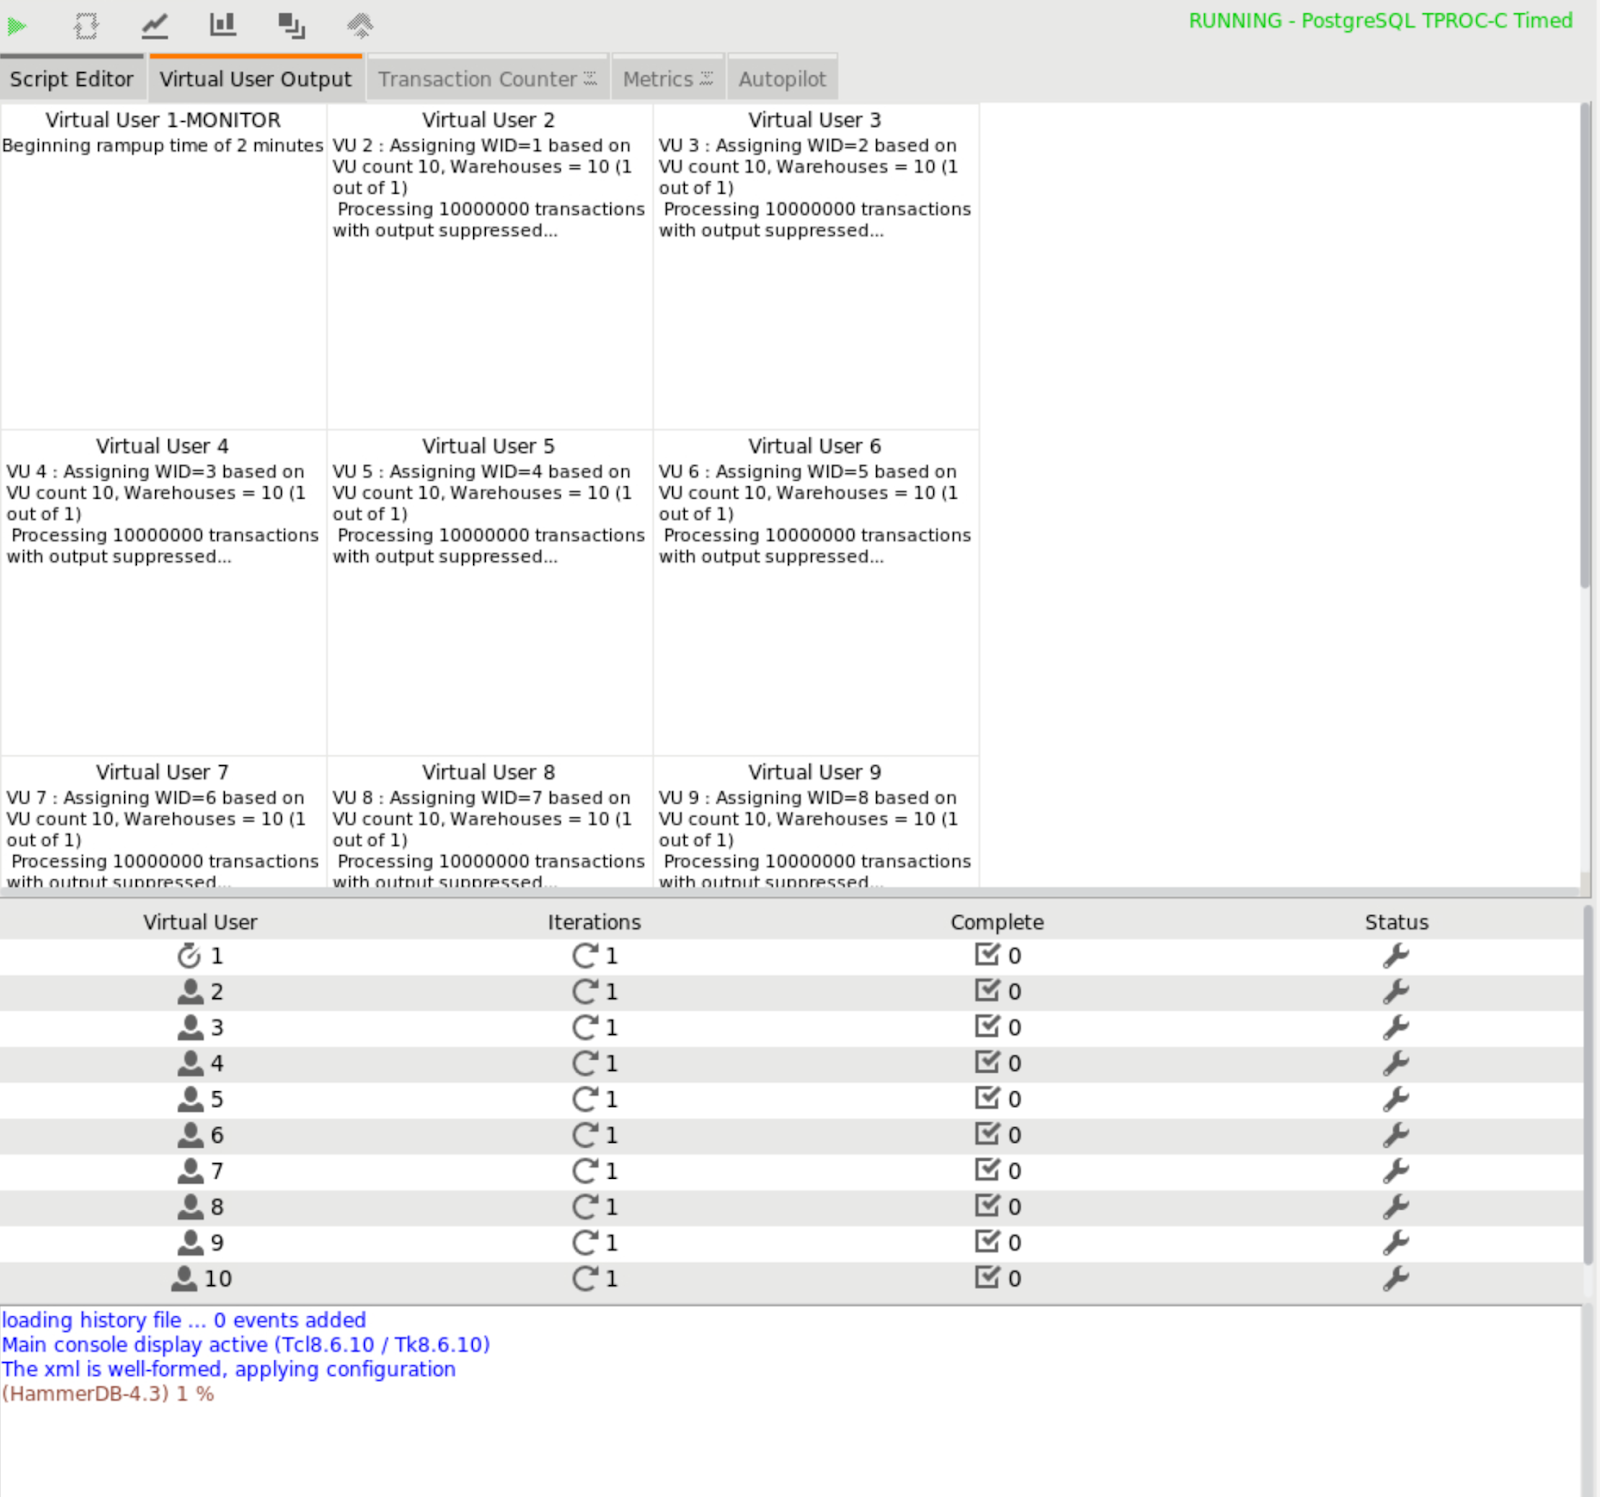
These screenshots taken at the beginning of the run shows the ten users “ramping up” for two minutes.
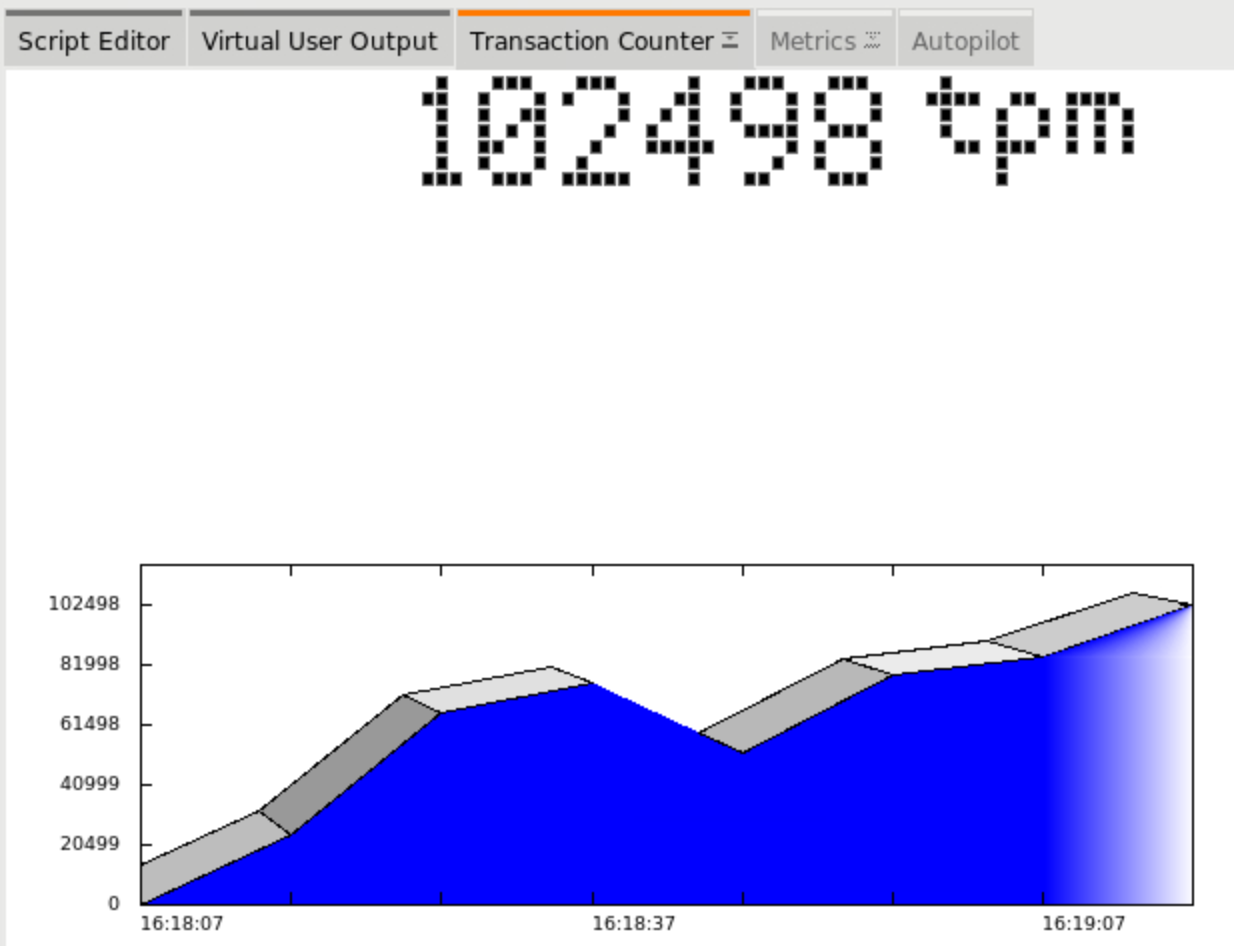
After less than a minute, PostgreSQL’s transactions per minute plateaued around 100,000 to 120,000 transactions per minute, with occasional dips.
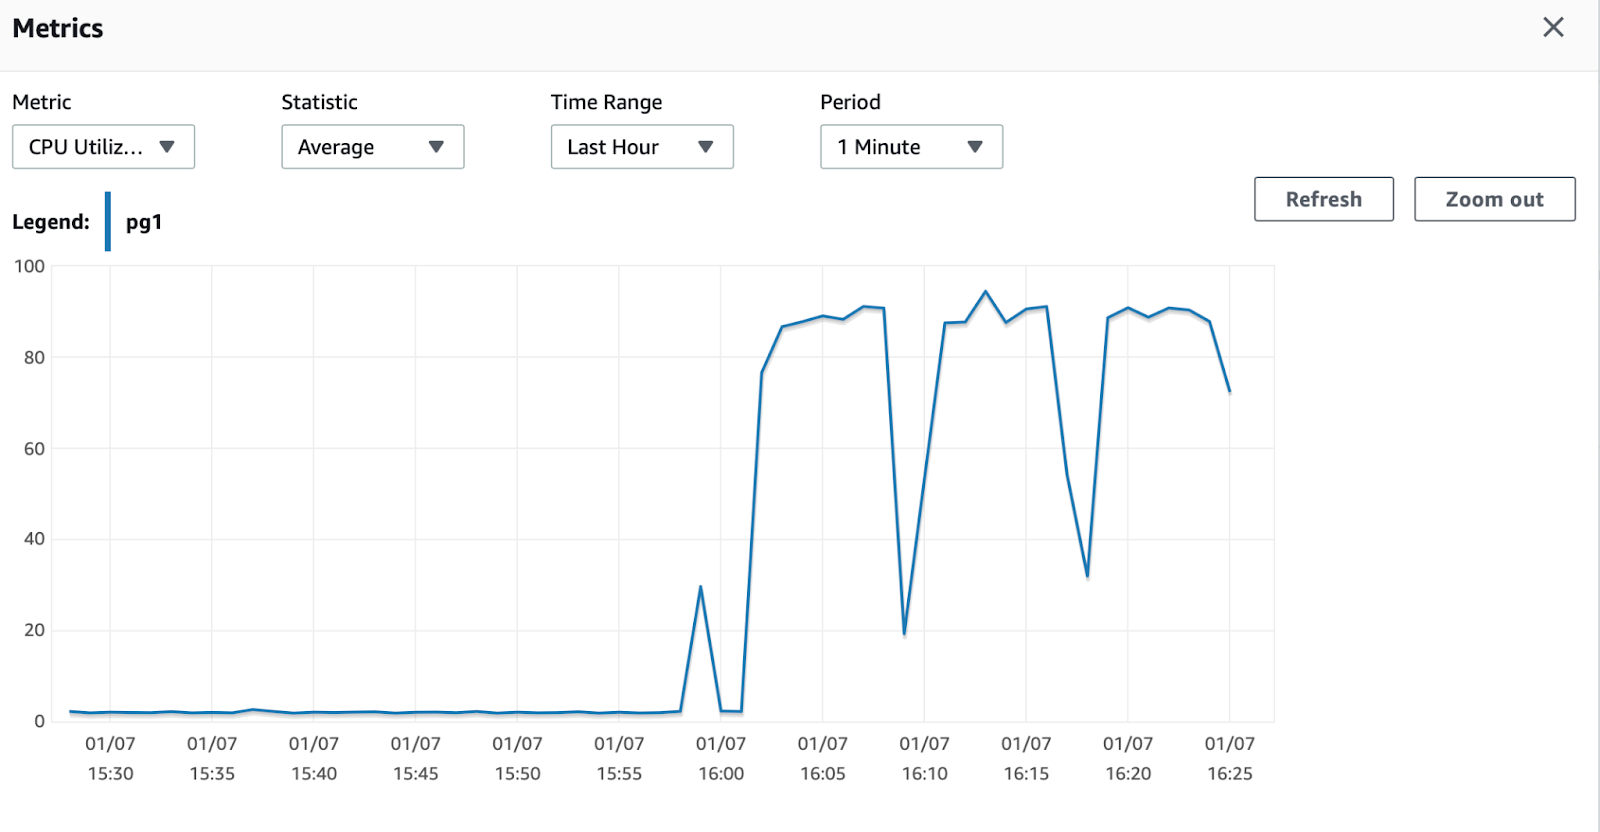
The AWS console shows that PostgreSQL, on average, used about 90% of its available CPU resources. Note: This chart shows me making three different runs (trying to get the logging right), which is why there are two significant dips in CPU usage.
MariaDB
Now we will run the same test with MariaDB. As you can see here, the settings are all left on default, except for “Use all warehouses,” just like PostgreSQL.

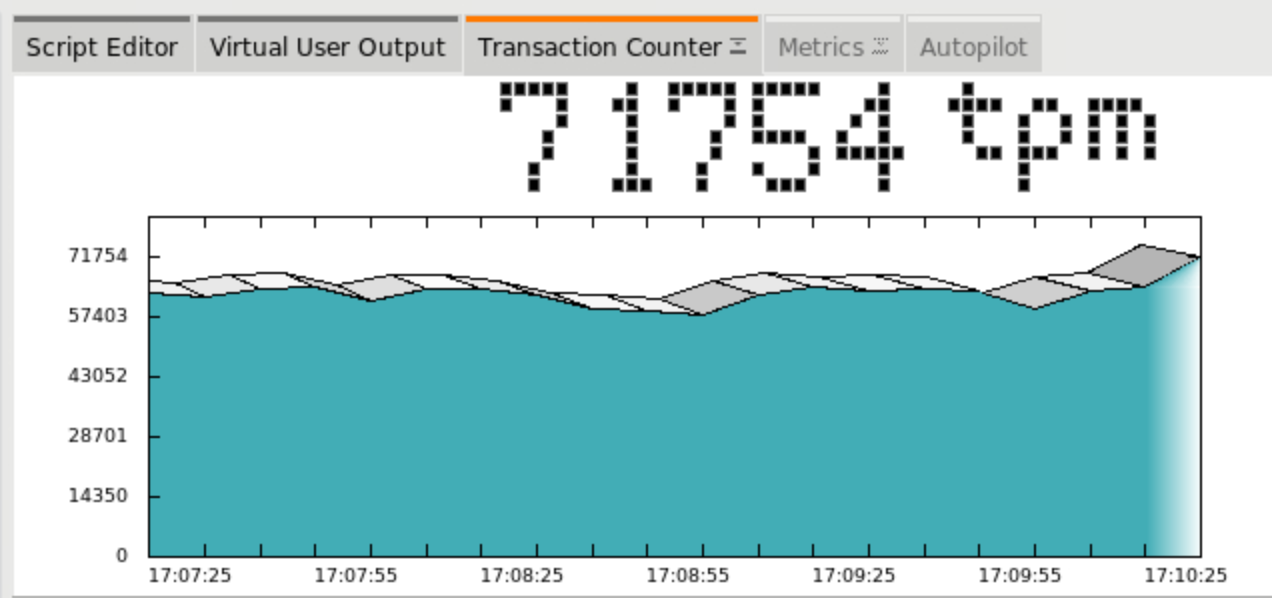
Interestingly, MariaDB seemed to ramp up to its maximum transactions per minute faster than PostgreSQL. However, it plateaued at a lower level.
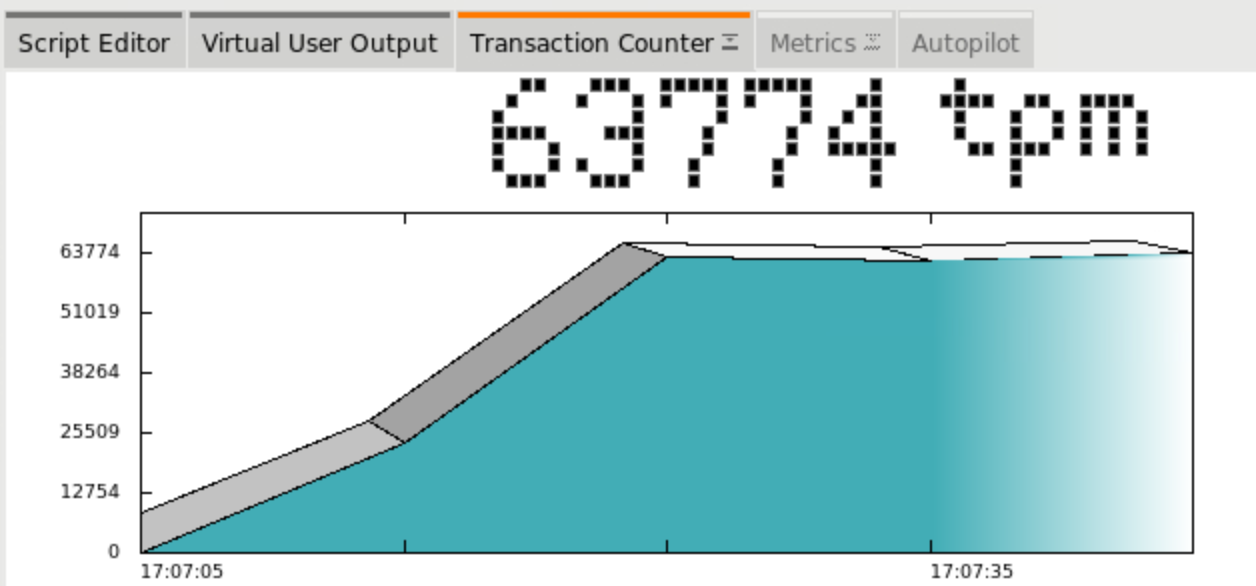
More interestingly, it showed a lot less variance in transactions per minute – it was rock solid, around 60,000 to 70,000 transactions per minute.
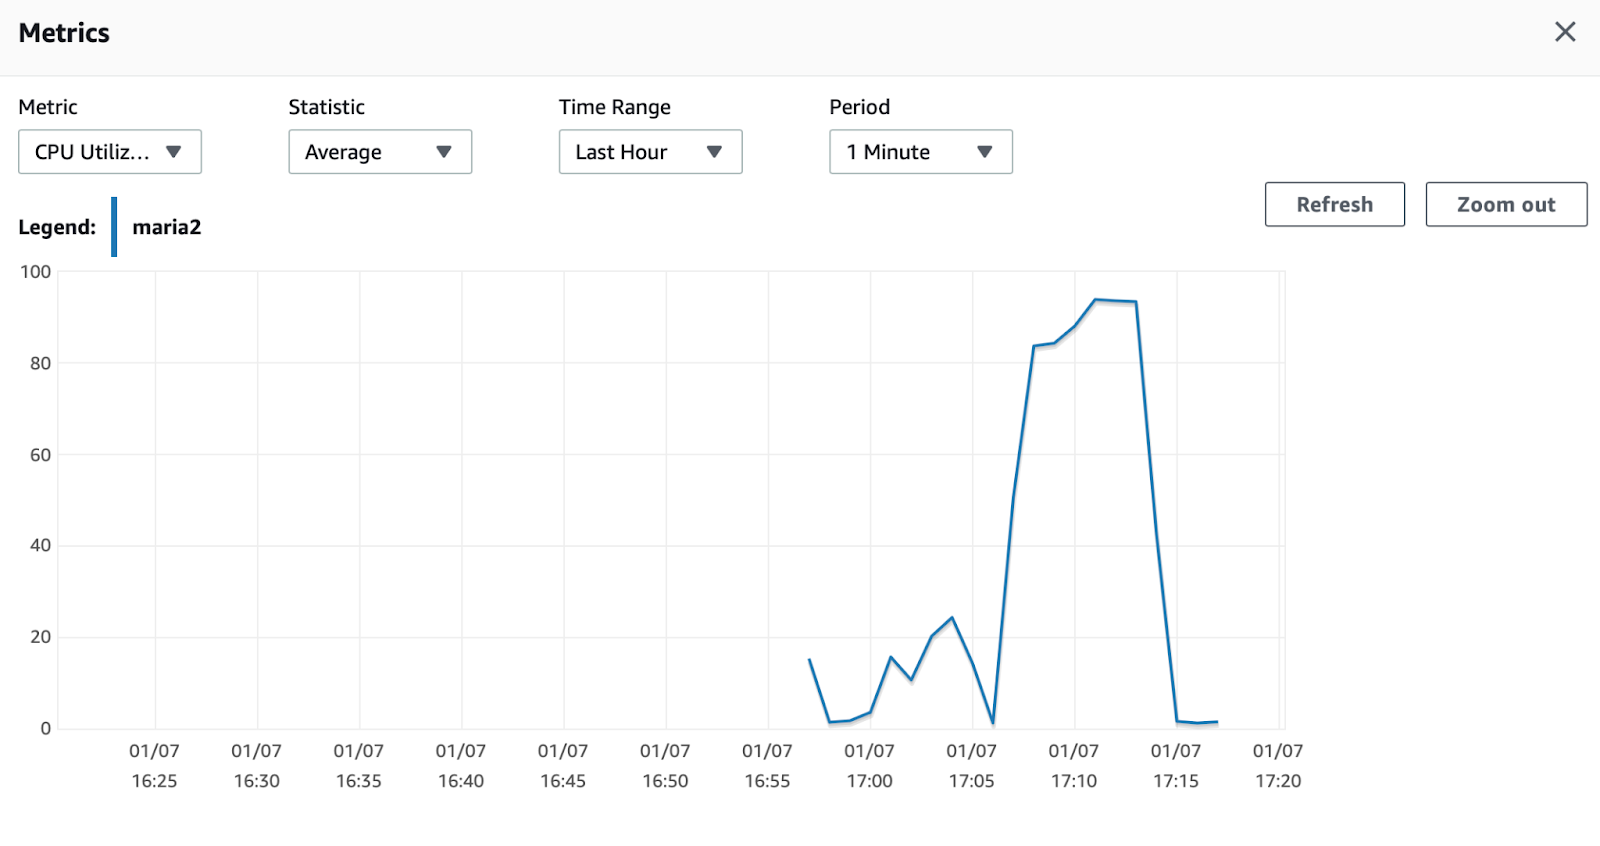
Looking at CPU usage on the AWS console shows similar results to PostgreSQL. It averaged around 90% usage of CPU resources.
MariaDB vs PostgreSQL benchmark results
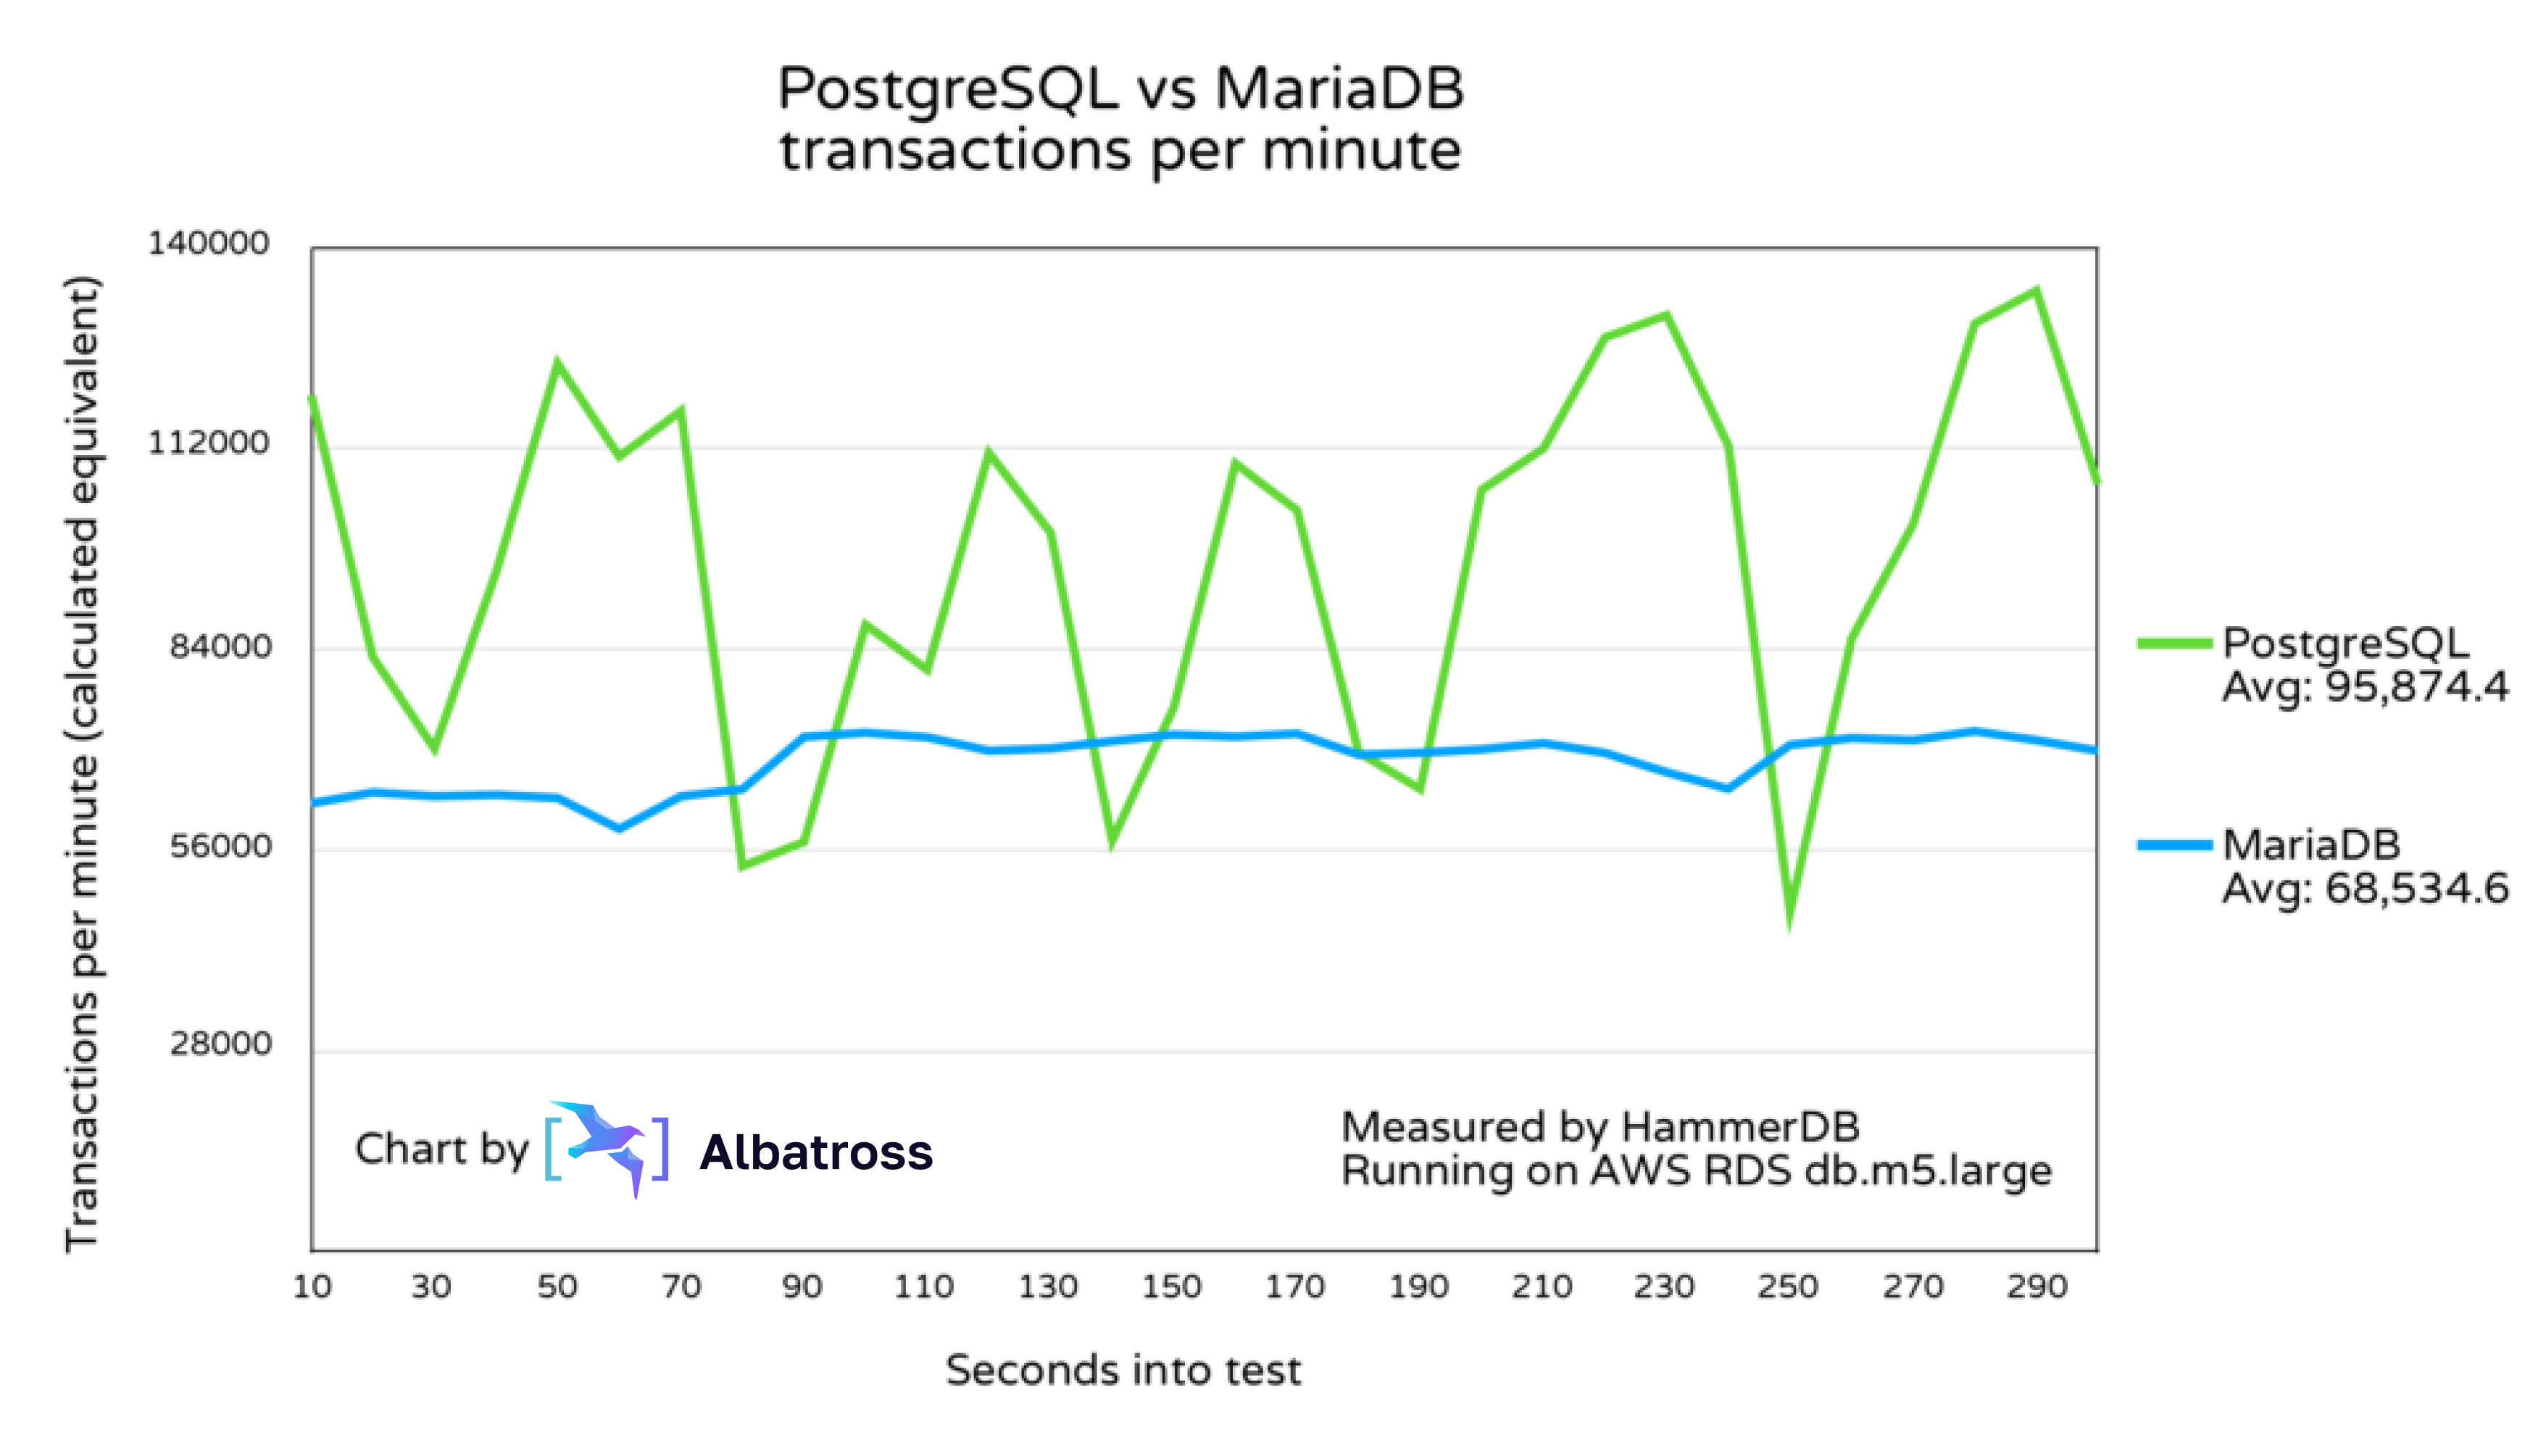
The chart above shows the transactions per minute performed by both systems after the initial 2-minute ramp-up period was complete. Two things stand out to me in the chart:
- Overall, PostgreSQL is faster than MariaDB by a wide margin.
- MariaDB’s transactions per minute was a lot more stable than PostgreSQL’s.
Why is MariaDB so much more consistent? Does PostgreSQL make some optimistic assumptions that allow it to perform better overall, at the expense of lost time? Is it faster at certain operations but slower at others? I will look into the possibilities more soon when doing more benchmarks.
The chart below shows HammerDB’s orders per minute metric. As stated in the docs, insertions into the order table is 45% of the work done by the benchmark.
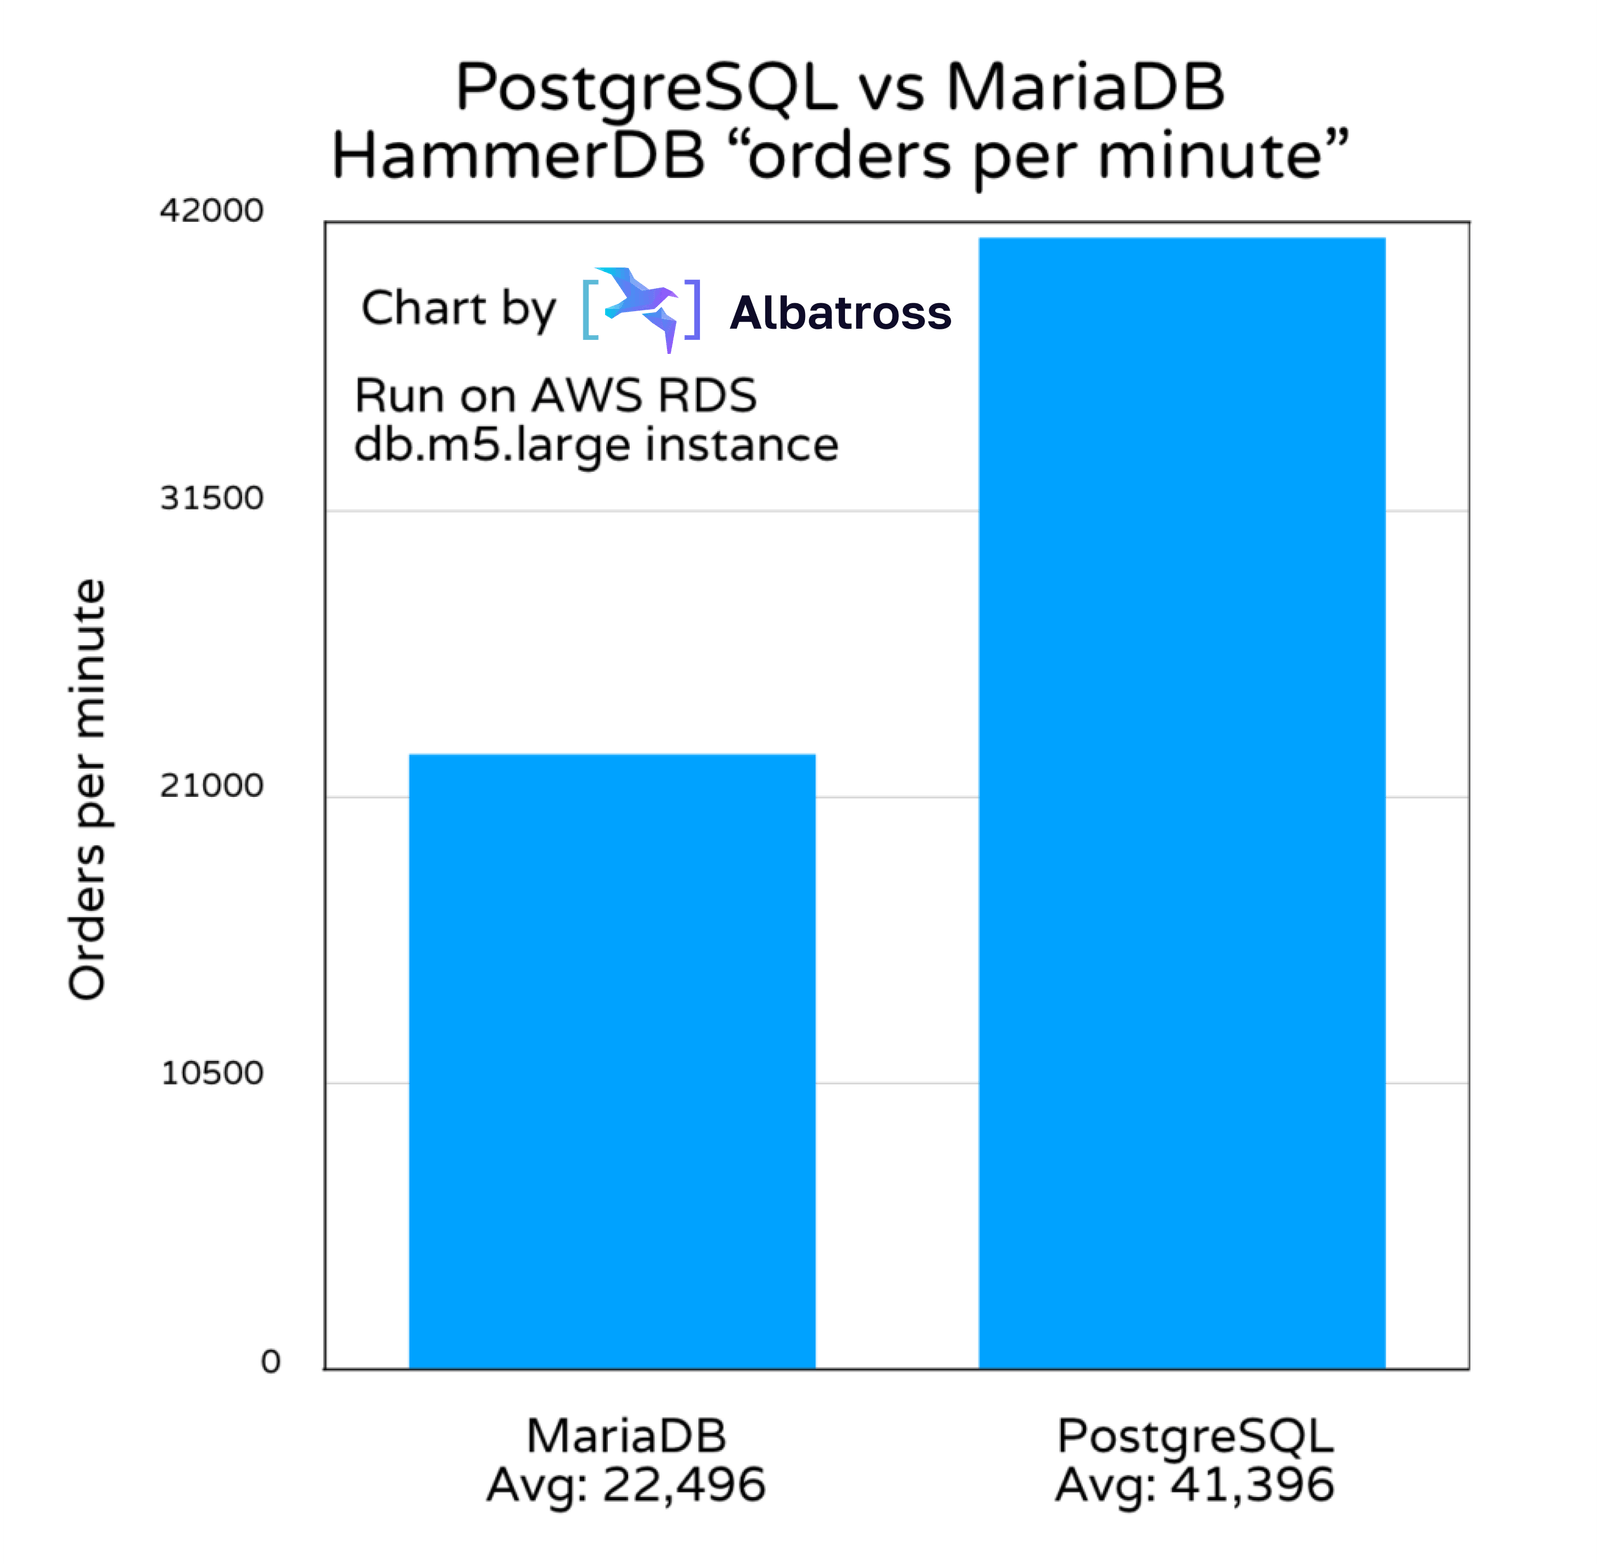
The number of transactions required to complete a given action can differ based on the DB system’s design. Measuring the number of insertions the database completes may offer a more accurate measure of the system’s performance. As such, we consider the above chart to be a more accurate representation of each database’s performance level.
In the end, PostgreSQL inserted 84% more orders than MariaDB while only needing 39% more transactions. This is an impressive performance win for PostgreSQL.
For transparency, let’s look at each database’s performance logs to see how we calculated results and allow you to audit our results.
- NOPM is the number of orders per minute.
- TPM is transactions per minute.
Benchmark logs
Here are the logs from the HammberDB tests.
PostgreSQL general test logs
Hammerdb Log @ Fri Jan 07 16:18:01 UTC 2022
+-+-+-+-+-+-+-+-+-+-+-+-+-+-+-+-+-+-+-+-+-+-
Timestamp 1 @ Fri Jan 07 16:18:09 UTC 2022
Vuser 1:Beginning rampup time of 2 minutes
Timestamp 2 @ Fri Jan 07 16:18:10 UTC 2022
Vuser 2:VU 2 : Assigning WID=1 based on VU count 10, Warehouses = 10 (1 out of 1)
Timestamp 2 @ Fri Jan 07 16:18:10 UTC 2022
Vuser 2:Processing 10000000 transactions with output suppressed…

… Many logs that look exactly the same as above

Timestamp 1 @ Fri Jan 07 16:19:09 UTC 2022
Vuser 1:Rampup 1 minutes complete ...
Timestamp 1 @ Fri Jan 07 16:20:09 UTC 2022
Vuser 1:Rampup 2 minutes complete ...
Timestamp 1 @ Fri Jan 07 16:20:09 UTC 2022
Vuser 1:Rampup complete, Taking start Transaction Count.
Timestamp 1 @ Fri Jan 07 16:20:09 UTC 2022
Vuser 1:Timing test period of 5 in minutes
Timestamp 1 @ Fri Jan 07 16:21:09 UTC 2022
Vuser 1:1 ...,

… Many logs that looks exactly the same as above

Vuser 1:Test complete, Taking end Transaction Count.
Timestamp 1 @ Fri Jan 07 16:25:10 UTC 2022
Vuser 1:10 Active Virtual Users configured
Timestamp 1 @ Fri Jan 07 16:25:10 UTC 2022
Vuser 1:TEST RESULT : System achieved 41396 NOPM from 95427 PostgreSQL TPM
PostgreSQL transactions log
Hammerdb Transaction Counter Log @ Fri Jan 07 16:18:05 UTC 2022
+-+-+-+-+-+-+-+-+-+-+-+-+-+-+-+-+-+-+-+-+-+-+-+-+-+-+-+-+-+-+-+
0 PostgreSQL tpm @ Fri Jan 07 16:18:07 UTC 2022
23514 PostgreSQL tpm @ Fri Jan 07 16:18:17 UTC 2022
65520 PostgreSQL tpm @ Fri Jan 07 16:18:27 UTC 2022
75858 PostgreSQL tpm @ Fri Jan 07 16:18:37 UTC 2022
51966 PostgreSQL tpm @ Fri Jan 07 16:18:47 UTC 2022
78126 PostgreSQL tpm @ Fri Jan 07 16:18:57 UTC 2022
84552 PostgreSQL tpm @ Fri Jan 07 16:19:07 UTC 2022
102498 PostgreSQL tpm @ Fri Jan 07 16:19:17 UTC 2022
129360 PostgreSQL tpm @ Fri Jan 07 16:19:28 UTC 2022
76722 PostgreSQL tpm @ Fri Jan 07 16:19:38 UTC 2022
65472 PostgreSQL tpm @ Fri Jan 07 16:19:48 UTC 2022
77298 PostgreSQL tpm @ Fri Jan 07 16:19:58 UTC 2022
79362 PostgreSQL tpm @ Fri Jan 07 16:20:08 UTC 2022
119226 PostgreSQL tpm @ Fri Jan 07 16:20:18 UTC 2022
82638 PostgreSQL tpm @ Fri Jan 07 16:20:28 UTC 2022
69834 PostgreSQL tpm @ Fri Jan 07 16:20:38 UTC 2022
94422 PostgreSQL tpm @ Fri Jan 07 16:20:48 UTC 2022
123588 PostgreSQL tpm @ Fri Jan 07 16:20:58 UTC 2022
110622 PostgreSQL tpm @ Fri Jan 07 16:21:08 UTC 2022
116982 PostgreSQL tpm @ Fri Jan 07 16:21:18 UTC 2022
53394 PostgreSQL tpm @ Fri Jan 07 16:21:28 UTC 2022
56808 PostgreSQL tpm @ Fri Jan 07 16:21:38 UTC 2022
87126 PostgreSQL tpm @ Fri Jan 07 16:21:48 UTC 2022
80850 PostgreSQL tpm @ Fri Jan 07 16:21:58 UTC 2022
111102 PostgreSQL tpm @ Fri Jan 07 16:22:08 UTC 2022
100014 PostgreSQL tpm @ Fri Jan 07 16:22:18 UTC 2022
57012 PostgreSQL tpm @ Fri Jan 07 16:22:28 UTC 2022
75600 PostgreSQL tpm @ Fri Jan 07 16:22:38 UTC 2022
109644 PostgreSQL tpm @ Fri Jan 07 16:22:48 UTC 2022
103122 PostgreSQL tpm @ Fri Jan 07 16:22:58 UTC 2022
69336 PostgreSQL tpm @ Fri Jan 07 16:23:08 UTC 2022
64176 PostgreSQL tpm @ Fri Jan 07 16:23:18 UTC 2022
105996 PostgreSQL tpm @ Fri Jan 07 16:23:28 UTC 2022
111750 PostgreSQL tpm @ Fri Jan 07 16:23:38 UTC 2022
127266 PostgreSQL tpm @ Fri Jan 07 16:23:48 UTC 2022
130368 PostgreSQL tpm @ Fri Jan 07 16:23:58 UTC 2022
112146 PostgreSQL tpm @ Fri Jan 07 16:24:08 UTC 2022
47106 PostgreSQL tpm @ Fri Jan 07 16:24:18 UTC 2022
85182 PostgreSQL tpm @ Fri Jan 07 16:24:28 UTC 2022
101190 PostgreSQL tpm @ Fri Jan 07 16:24:38 UTC 2022
129216 PostgreSQL tpm @ Fri Jan 07 16:24:48 UTC 2022
133782 PostgreSQL tpm @ Fri Jan 07 16:24:58 UTC 2022
106734 PostgreSQL tpm @ Fri Jan 07 16:25:08 UTC 2022
33378 PostgreSQL tpm @ Fri Jan 07 16:25:18 UTC 2022
126 PostgreSQL tpm @ Fri Jan 07 16:25:28 UTC 2022
102 PostgreSQL tpm @ Fri Jan 07 16:25:38 UTC 2022
MariaDB general test logs
Hammerdb Log @ Fri Jan 07 17:07:07 UTC 2022
+-+-+-+-+-+-+-+-+-+-+-+-+-+-+-+-+-+-+-+-+-+-
Timestamp 1 @ Fri Jan 07 17:07:09 UTC 2022
Vuser 1:Beginning rampup time of 2 minutes
Timestamp 2 @ Fri Jan 07 17:07:10 UTC 2022
Vuser 2:VU 2 : Assigning WID=1 based on VU count 10, Warehouses = 10 (1 out of 1)
Timestamp 2 @ Fri Jan 07 17:07:10 UTC 2022
Vuser 2:Processing 10000000 transactions with output suppressed...

… Many logs that looks exactly the same as above

Timestamp 1 @ Fri Jan 07 17:08:09 UTC 2022
Vuser 1:Rampup 1 minutes complete ...
Timestamp 1 @ Fri Jan 07 17:09:09 UTC 2022
Vuser 1:Rampup 2 minutes complete ...
Timestamp 1 @ Fri Jan 07 17:09:09 UTC 2022
Vuser 1:Rampup complete, Taking start Transaction Count.
Timestamp 1 @ Fri Jan 07 17:09:09 UTC 2022
Vuser 1:Timing test period of 5 in minutes
Timestamp 1 @ Fri Jan 07 17:10:09 UTC 2022
Vuser 1:1 ...,

… Many logs that looks exactly the same as above

Vuser 1:Test complete, Taking end Transaction Count.
Timestamp 1 @ Fri Jan 07 17:14:09 UTC 2022
Vuser 1:10 Active Virtual Users configured
Timestamp 1 @ Fri Jan 07 17:14:09 UTC 2022
Vuser 1:TEST RESULT : System achieved 22496 NOPM from 68574 MariaDB TPM
MariaDB transactions log
Hammerdb Transaction Counter Log @ Fri Jan 07 17:07:03 UTC 2022
+-+-+-+-+-+-+-+-+-+-+-+-+-+-+-+-+-+-+-+-+-+-+-+-+-+-+-+-+-+-+-+
0 MariaDB tpm @ Fri Jan 07 17:07:05 UTC 2022
23058 MariaDB tpm @ Fri Jan 07 17:07:15 UTC 2022
62820 MariaDB tpm @ Fri Jan 07 17:07:25 UTC 2022
62058 MariaDB tpm @ Fri Jan 07 17:07:35 UTC 2022
63774 MariaDB tpm @ Fri Jan 07 17:07:45 UTC 2022
64536 MariaDB tpm @ Fri Jan 07 17:07:55 UTC 2022
60996 MariaDB tpm @ Fri Jan 07 17:08:05 UTC 2022
63810 MariaDB tpm @ Fri Jan 07 17:08:15 UTC 2022
63924 MariaDB tpm @ Fri Jan 07 17:08:25 UTC 2022
62310 MariaDB tpm @ Fri Jan 07 17:08:35 UTC 2022
59196 MariaDB tpm @ Fri Jan 07 17:08:45 UTC 2022
58752 MariaDB tpm @ Fri Jan 07 17:08:55 UTC 2022
57858 MariaDB tpm @ Fri Jan 07 17:09:05 UTC 2022
62622 MariaDB tpm @ Fri Jan 07 17:09:15 UTC 2022
64134 MariaDB tpm @ Fri Jan 07 17:09:25 UTC 2022
63606 MariaDB tpm @ Fri Jan 07 17:09:35 UTC 2022
63804 MariaDB tpm @ Fri Jan 07 17:09:45 UTC 2022
63378 MariaDB tpm @ Fri Jan 07 17:09:55 UTC 2022
59142 MariaDB tpm @ Fri Jan 07 17:10:05 UTC 2022
63600 MariaDB tpm @ Fri Jan 07 17:10:15 UTC 2022
64578 MariaDB tpm @ Fri Jan 07 17:10:25 UTC 2022
71754 MariaDB tpm @ Fri Jan 07 17:10:35 UTC 2022
72336 MariaDB tpm @ Fri Jan 07 17:10:45 UTC 2022
71700 MariaDB tpm @ Fri Jan 07 17:10:55 UTC 2022
69858 MariaDB tpm @ Fri Jan 07 17:11:05 UTC 2022
70170 MariaDB tpm @ Fri Jan 07 17:11:15 UTC 2022
71172 MariaDB tpm @ Fri Jan 07 17:11:25 UTC 2022
72072 MariaDB tpm @ Fri Jan 07 17:11:35 UTC 2022
71784 MariaDB tpm @ Fri Jan 07 17:11:45 UTC 2022
72210 MariaDB tpm @ Fri Jan 07 17:11:55 UTC 2022
69306 MariaDB tpm @ Fri Jan 07 17:12:05 UTC 2022
69576 MariaDB tpm @ Fri Jan 07 17:12:15 UTC 2022
70050 MariaDB tpm @ Fri Jan 07 17:12:25 UTC 2022
70878 MariaDB tpm @ Fri Jan 07 17:12:35 UTC 2022
69552 MariaDB tpm @ Fri Jan 07 17:12:45 UTC 2022
66912 MariaDB tpm @ Fri Jan 07 17:12:55 UTC 2022
64632 MariaDB tpm @ Fri Jan 07 17:13:05 UTC 2022
70638 MariaDB tpm @ Fri Jan 07 17:13:15 UTC 2022
71598 MariaDB tpm @ Fri Jan 07 17:13:25 UTC 2022
71298 MariaDB tpm @ Fri Jan 07 17:13:35 UTC 2022
72540 MariaDB tpm @ Fri Jan 07 17:13:45 UTC 2022
71292 MariaDB tpm @ Fri Jan 07 17:13:55 UTC 2022
69846 MariaDB tpm @ Fri Jan 07 17:14:05 UTC 2022
59406 MariaDB tpm @ Fri Jan 07 17:14:15 UTC 2022
A note about averages
Eagle-eyed observers may note that my chart’s “transactions per minute” averages are slightly different from HammerDB’s printed logs. This is because I truncated the results to fit neatly within 30 10 second intervals to create the chart.
Conclusions
PostgreSQL is faster than MariaDB at data management. PostgreSQL inserted 84% more orders than MariaDB while only needing 39% more transactions. This signals that the PostgreSQL global development group is doing a good job optimizing available resources and minimizing the number of transactions needed for a unit of real work.
The transactions per minute figures are more consistent with MariaDB, but the metric we care about, orders per minute, isn’t broken out over time like transactions. I may try to break out orders with a time dimension in a future revision to this article. The MariaDB Foundation is handcuffed by its original purpose of offering a database with MySQL compatibility. However, this should only affect a client’s view of the database, not the actual transaction processing itself. It would be interesting to see how using the Spider storage engine would affect performance.
In a future article, we may rerun this test using multiple nodes comparing PostgreSQL to MariaDB with synchronous replication to see which one has better performance in large deployments.